This three-part case study focuses on two of the company’s diagnostic clinics – Centers A and B. In Part One, the company worked at Center A to reduce patient turnaround time, a defining component of patient satisfaction. Part Two of the chain’s improvement story focuses on increasing patient delight at Center B. Part Three revisits Center A to improve the turnaround time of lab reports.
Almost all organizations will identify customer satisfaction as an area for improvement and as key to business success. But what happens when they are asked what needs to be done to achieve customer satisfaction? A business leader is likely to share a story or two of irate customers as examples of the problem – offering a reason (excuse) why that situation is unavoidable, or, rather, just a rare occurrence and so nothing needs to be done about it.
When business leaders feel the opportunity for improvement is not within their control, it is important to develop a checklist of problems (or, alternatively, desirables) that define the customer’s relationship with the company. Next, a business must find a way to either kill the problems or to consistently provide the customer’s wants and needs.
For Center B, two methods were used:
- Observe the customer. Each member of the improvement team was asked to observe customers (patients, in this case) across varying locations for half an hour during a one-week period and note any problems they observed.
- Customer’s voice. A feedback form captured both dissatisfaction and satisfaction moments that customers experienced.
The observations and feedback were collated, prioritized, discussed and resolved. At the end of the first full month of data collection, the complaints noted on the feedback form showed as follows:
- Average complaints per day = 5.8
- Standard deviation (σ) = 2.3
- Average + 3σ = 12.7
In phase one, the chain’s goal was to reduce the complaints per day by 50 percent.
To do so, a systematic fortnightly cycle of “killing” observed problems was instituted. Examples of the complaints (i.e., problems) with their root causes and associated countermeasures are shown in Table 1 below.
| Table 1: Problems and Countermeasures for Center B Customers | ||
| Problems | Root Causes | Countermeasures |
| Wheelchair being carried down stairs |
|
Smaller wheelchair |
| Ambulance needed to transfer patient to clinic, but ambulance is unavailable | Early morning/driver not available | Call other clinics for transportation alternatives |
| Diabetic patient dizzy while waiting | Sugar levels fall | Food is stored specifically to offer to diabetic patients in need |
| Stock runs out (e.g., paper cups and ultrasound tissues) | No inventory planning |
|
| Errors in patient information (e.g., name, age) | Human typing errors |
|
| Odor in restrooms | Exhaust fan not working | Fix fan |
Over the course of eight months, 75 such observations were collected and 90 percent were resolved. Gradually the leadership’s mindset began changing as these small actions added up to a perceptible improvement.
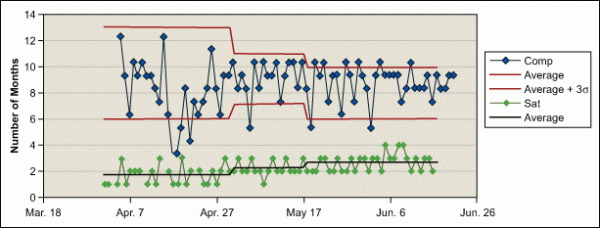
It was three months, however, before a metric for progress evolved. It was discovered that the center had been giving some patients a feedback form. The form allowed customers to tick relevant categories of any complaints that they might have. It also provided a check box to tick if they were “fully satisfied.” These forms were being filled out and then simply filed. Once change process leaders learned about these forms, the forms were pulled from files and collated. The number of complaints and fully satisfied customers were calculated. This information was displayed in the Xbar control chart shown in Figure 1, where the first month represents the pre-project state. Subsequent points measure customer delight as the project proceeded.

The results of the first three months of improvement efforts are shown in Table 2.
| Table 2: Results of First Three Months of Improvement Efforts | |||
|
April |
May |
June |
|
| Number of Complaints Per Day | |||
| Average |
5.8 |
6.5 |
6.1 |
| Standard Deviation |
2.3 |
1.6 |
0.9 |
| Average + 3σ |
13 |
11.4 |
8.8 |
| Number of Fully Satisfied Patients Per Day | |||
| Average |
1.7 |
2.3 |
2.7 |
| Standard Deviation |
2.3 |
1.6 |
0.7 |
As the table shows, the high complaints per day reduced as the number of fully satisfied customers increased – both trends were encouraging. The average + 3σ for the number of complaints received per day decreased by 32 percent, and the daily average number of fully satisfied patients increased 60 percent.
The compilation and recording of complaints led to their being prioritized (based upon the frequency of their occurrence). Nineteen complaint categories are listed in Table 3.
| Table 3: Complaint Categories and Frequency | ||||
|
Complaint Category Number |
Complaint |
Frequency Per Day |
Percentage |
Cumulative Percentage |
|
1 |
Waiting time for tests or registration/billing |
12 |
15 |
15 |
|
2 |
Waiting time for reports |
11 |
14 |
29 |
|
3 |
Waiting time for phone calls to be answered |
10 |
13 |
42 |
|
4 |
Waiting time despite having appointment |
7 |
8.9 |
51 |
|
5 |
Odor in restrooms |
6 |
7.6 |
59 |
|
6 |
Front office/staff not helpful |
4 |
5.1 |
64 |
|
7 |
Not enough parking spaces |
4 |
5.1 |
69 |
|
8 |
Directions provided for the sequence of testing were not clear (which led patients to go from the third floor where testing occurred and back to the ground floor for correct/new instructions) |
3 |
3.8 |
73 |
|
9 |
Lack of cafeteria (particularly a problem for diabetic patients who required further testing and had to leave the center to find food) |
3 |
3.8 |
76 |
|
10 |
Small elevator |
3 |
3.8 |
80 |
|
11 |
Inconvenience of reports on third floor and billing on the ground floor |
3 |
3.8 |
84 |
|
12 |
Dissatisfaction with first floor staff |
2 |
2.5 |
86 |
|
13 |
Older patients desired priority for procedures |
2 |
2.5 |
89 |
|
14 |
Clinic personnel were not gloved/wearing slippers during procedures |
2 |
2.5 |
91 |
|
15 |
Token system at billing/registration |
2 |
2.5 |
94 |
|
16 |
Low-quality sheets used on imaging machines |
1 |
1.3 |
95 |
|
17 |
CT/MRI results were not reviewed in private |
1 |
1.3 |
97 |
|
18 |
Unsatisfactory patient-doctor interaction |
1 |
1.3 |
98 |
|
19 |
Credit card machine problems |
1 |
1.3 |
99 |
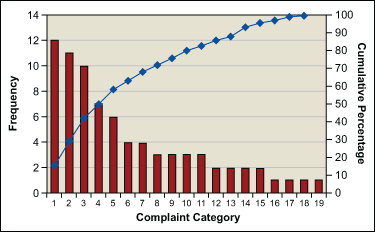
A further look at these complaints is displayed in the pareto chart shown in Figure 2.

The most significant four complaints (51 percent of total) by patients were about “waiting”: waiting for laboratory tests and registration/billing, waiting to collect reports, waiting for phone responses, and waiting despite having an appointment. By addressing complaint categories 1 through 4, 70 percent of the overall problems would be mitigated. Center A had already reduced waiting time at registration/billing and in the laboratory. The analyzed data in Center B revealed similar problems with similar causes as those encountered in Center A. Similar countermeasures were applied after staff training was conducted. (Editor’s note: These problems and solutions are described in Part 1 of this case study.)
The problem of a delay in phone responses was examined with a root cause analysis. It was discovered that calls received in the evenings after 5:30 p.m. were taking a long time to get a response because staffing levels were lower. Interestingly, this was a peak time for calls, as patients often rang up with inquiries after (presumably) getting home from work. Staffing levels were increased to match the call volume.
The root cause analysis of excessive waiting time despite having appointments produced a simple solution. Wait times were found to be happening for two reasons: the receptionist did not know the patient had an appointment and the patient was in a line with walk-in patients.
A sign was placed at a spot in the reception area specifically for patients with appointments. These patients were “captured” upon arrival and processed at a faster rate.
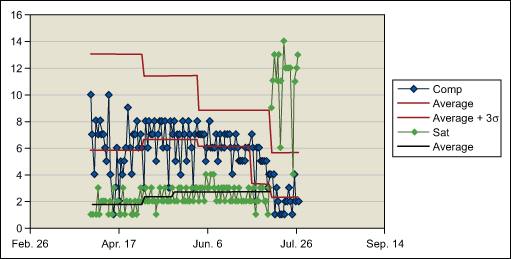
Countermeasures for three of the main four problems were implemented on July 11 and produced dramatic results, as shown in Figure 3 and Table 4.

| Table 4: Effects of Countermeasures | ||
|
April |
Beginning July 12 |
|
| Number of Complaints Per Day | ||
| Average |
5.8 |
2.2 |
| Standard Deviation |
2.3 |
1.1 |
| Average + 3σ |
13 |
5.5 |
| Number of Fully Satisfied Customers Per Day | ||
| Average |
1.7 |
11 |
| Standard Deviation |
2.3 |
2.6 |
| Average + 3σ |
8.6 |
19 |
The average number of daily complaints decreased by 60 percent, and the average number of patients per day describing themselves as fully satisfied increased a whopping 600 percent.
Sustaining the Changes
Following the oft-quoted dictum “if you do not improve, you deteriorate,” a small team was charged with continuing the observations, meeting once a day and killing problems using the problem-root cause analysis-countermeasure-test-check result method.
Over the next three months, performance improved even further. Described below are two examples of other problems that were encountered and their resulting solutions:
1. Consider a situation in which a patient is billed as per prescription, but when meeting the doctor the patient is advised to take an additional test. The patient undertakes the test. For billing, the nurse calls the billing department, which forgets to create the additional bill. When the patient comes to collect the report, it is not ready as the computer system blocks issuance of a final report if the payment is not complete. The patient then has to go from counter to counter to complete the process of payment and collect the report.
Countermeasure: A written slip was introduced wherein such a change is indicated in writing by the testing department and then transferred to the billing department. With this simple change, 90 percent of these errors were eliminated.
2. Another problematic situation that could be encountered was when a patient asks for a discount at the registration counter, contending that a sales representative of the center had authorized the lower charge. An unpleasant interaction occurs as the registration employee is not authorized to give the discount and the representative in question is not available for confirmation.
Countermeasure: The sales general manager was consulted and a list of patient categories that are automatically entitled to a discount were listed – the value of the available discount was quantified. This list was made available to the registration desk and the staff was told that no other discounts are to be allowed. The sales manager is happy with this process; this will prevent billing staff giving unwarranted discounts. If a legitimate example of this instance falls outside these boundaries, then the sales staff person must provide a written authorization to the patient before the patient reaches billing.
Many such improvements continued as problems arose. The final improvement achievement levels are summarized below:
|
Before |
After |
|
|
Number of Complaints |
5.8 |
1.33 |
|
Fully Satisifed Patients |
1.7 |
9.5 |
The number of complaints decreased 75 percent, while the number of fully satisfied customers increased by 400 percent.
Conclusion
When asked what each member had learned during the project, they shared the following comments:
- Analyze data before jumping to conclusions
- Follow the process
- Analyze what is required for the customer and then explore how to execute solutions
- Identify pain areas and find solutions for continuous improvement
- Basic discipline has to be followed
- Small is big
- Clarity in operations and correction of errors can be achieved only by evaluating data
- Everyone is responsible
- A structured approach to problem solving is key
- Learning happens in a group
- Good coordination helps maintain quality
- If I complain, I must be ready to solve problems
Data-based analysis in a structured group effort – following a process of measurement, prioritization, analysis and problem killing (big and small) – creates patient delight.