A division of a diversified organization develops and manufactures samples of new drugs for clinical trials. This work entails different typical manufacturing problems for the following reasons:
- Quantity requirements can vary from a few grams to several tons from order to order.
- The effort of research and development (R&D) is central; new processes have to be developed from scratch for each new molecule.
- Translating the R&D process on the production floor inevitably exposes new problems and leads to ideas for improvement for filling repeat orders. Processes need to be scaled up due to higher quantity requirements for repeat orders. Converting R&D processes into production remains key to meeting quality, delivery and cost requirements.
- Jobs are quoted in a competitive environment. Quotations involve a high ignorance-to-knowledge ratio. The customers’ requirement of short turnaround times for quotes is critical to the success of the organization.
- Add to the above the fact that any molecule can fail at any stage of the clinical trials. There is, therefore, uncertainty about whether repeat orders will come. The amount of resources put into R&D is unknown as future orders are uncertain. Total R&D expenditures have to be recovered against the order in hand.
The division had recently received heavy investments and needed to quickly grow its production volumes to get into the black.
The senior management team wanted to address the slow turnaround from customer inquiries to quote submission. Total quality management (TQM) was the selected methodology for addressing this problem.
Getting Started
The effort began with a two-day “quality mindset” program for the 20 most senior managers from all areas of the business, including the CEO. This program introduced the team to the basics of TQM. A cross-functional team of personnel from operations, R&D, sales (business development), planning, finance and operations excellence was selected to solve the problem.
The project followed TQM’s seven steps of problem solving.
- Define the problem
- Research the causes
- Generate countermeasure ideas
- Test and modify the ideas
- Implement ideas
- Standardize procedures
- Compile quality improvement story
Step 1: Define the Problem
brainstorming the causes of the slowdown produced the items shown in Table 1.
| Table 1: Results of Brainstorming Exercise | ||
| Problems Identified | Category | Seriousness of Problem (1=low, 5=high) |
| On-time delivery of product | Delivery | 2 |
| Time to submit quote | Quote | 3 |
| Price does not achieve customer’s price expectation | Quote | 5 |
| Response time for quote queries | Quote | 1 |
| Transparent communication to customer | Communication | 1 |
| Delivery in proposal too high | Quote | 3 |
| Lower yields and capacity constraints | Quote | 1 |
| On-time quality reports | Communication | 1 |
The problems were categorized and the “quote” emerged as the vital consensus problem category. When participants were asked to score the problems based on their relative importance, “price does not achieve customer’s price expectation” (i.e., the quoted price is too high) was revealed as the primary issue within that broader category of “quote.”
This realization was, at first, a surprise. On reflection the group realized the soundness of the logic – customers prefer a lower price to a quicker quote. When discussing what would be the result of lowered price, the answer was an increased win rate that would lead to faster business growth.
The problem, therefore, seemed to stem from low volumes (the associated factory was utilized at only 30 percent) – the result of a low win rate (WR) which in turn resulted from too high a price. The problem was win rate, and price was the perceived cause. The project objective was redefined as achieving a “dramatic improvement in win rate.”
In TQM, the problem = desire – current status. To define the current status the team was asked: “What is the win rate now?” Team members replied, “For what period do you want the WR?” There was confusion when told they should know for what period they were referring to in their problem statement. They were then asked to write down whatever they thought was the WR using whatever definition they thought was appropriate.
Different answers emerged indicating the lack of a clear, universally accepted metric.
Data was pulled for the past six months. At this point another consideration was discussed; should the WR ratio be computed in dollars or the number of proposals?
WR = orders won/total proposals requested
or
WR = dollars won/total dollars of proposals requested
This meant that if the orders won were those (relatively) smaller in value, then the monetary WR would be significantly lower than the straight numbers WR and vice versa. Data was collected – dates, inquiry numbers, value of proposals and their statuses.
When the data was analyzed the status column had the following entries: won, pending, on hold, obsolete, cancelled, rejected or lost. An analysis of the data quickly revealed that the average monetary value of orders won was significantly lower than the average monetary value of inquiries received. After a prolonged discussion, the team decided to measure the WR in terms of monetary value.
At this time, an intervention from the team member from business development was crucial to shaping the project and its success. He reasoned that the business could be split into two distinct types – new and repeat formulations. The former required a lot of R&D, were necessarily much smaller in volume and monetary value and, seemingly, less desirable to win. The profitability of the business came from the much higher value of repeat orders, which were easier to get. There would be no repeat orders, however, if the flow of new formulations was not developed. The emphasis should, therefore, be on increasing the new formulation WR.
This logic made sense and the data was split into two groups – new and repeat proposals as shown in Table 2 below. There were a total of 104 proposals received, including 48 pending.
| Table 2: New and Repeat Order Proposals | |||
| Proposals | |||
| New Orders | Repeat Orders | Total | |
| Proposals won/lost | 38 | 18 | 56 |
| Won | 7 | 12 | 19 |
| Lost | 5 | 4 | 9 |
| Cancelled | 4 | 0 | 4 |
| Obsolete | 4 | 2 | 6 |
| Rejected | 18 | 0 | 18 |
During the last six months the WR performance was as follows:
Total WR (percentage of all proposals decided) = 34 percent
New WR (NWR) = 13 percent
Repeat WR (RWR) = 67 percent
Increasing the NWR percentage was identifiable as the vital problem. Discussion among the group led to a consensus that the team should strive to increase the NWR from the current level of 13 percent to 25 percent.
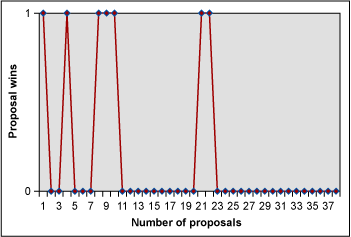
At this point, the past data of the new proposals was tabulated in chronological order. Won proposals were assigned a value of 1 and lost proposals a value of 0. A graph was plotted to track the wins and losses and is shown in Figure 1 below.

This visual display of data revealed the following: NWR = 7/38 = 18 percent. Five out of seven proposals won were in the first 11 proposals submitted (i.e., the NWR up to then was 5/11 or 45 percent). No proposal, however, had been won in the last 14 proposals; the NWR in the past quarter was zero. A NWR based upon equal batch size was indicated for improvement tracking. A batch size of 20 was agreed upon. The metric was changed to: ([proposals won] * 100 / [last 20 new proposals]).
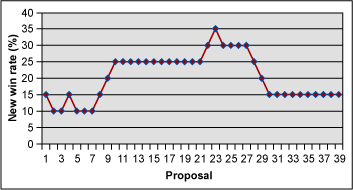
The data shown in Figure 1 was converted into a moving average tracker as shown in Figure 2.

The goal was now defined as increasing the ratio of NWR/20 proposals from:
Current = 5 percent (two wins in last 38 proposals)
to
Desired = 25 percent (team consensus after discussion)
Step 2: Research the Causes
As shown in Table 2, the two top categories of proposals were:
Rejected = 18/38 = 47 percent
Lost = 7/38 = 18 percent
Rejected proposals were not accepted by the organization because large capital investment requirements for isolated orders were unjustified. Lost proposals were the main category to be resolved. Three possible causes were identified:
- Prices of proposals were too high
- Delivery of proposals were delayed
- Delivery of products were delayed
Item 3 was checked using data of past deliveries and confirmed to be satisfactory at the time of this project. In looking at items 1 and 2, price was unanimously agreed upon as key.
The price of proposals being discussed was the “quoted” price. The proposals could be high due to costs (fixed and variable) and buffers in cost estimates. The first instinct of most companies is to reduce costs to justify lowering prices. Two background factors, however, led the improvement team down another path:
- Fixed costs were high due to low capacity utilization (30 percent). This would be substantially corrected if the WR increased.
- Variable cost reduction is a time-consuming and complex process; it would be examined only if simpler and quicker options failed.
Steps 3 and 4: Generate Countermeasure Ideas and Test and Modify the Ideas
The company considered reducing prices while keeping the rest of the process unchanged. Would a carefully calibrated price decrease lead to an increase in the WR (and, therefore, volume) so much that the consequent reduction in the percentage of fixed costs/revenue would largely compensate for the price decrease and leave the percentage of EBIDTA (earnings before interest, tax, depreciation and amortization) unchanged?
The sales representative was queried: How much of a price reduction would need to be made to significantly affect the NWR? His guess was:
- 10 percent price decrease = NWR increases from 18 percent to 25 percent
- 15 percent price decrease = NWR increases from 18 percent to 33 percent
How was the quoted price arrived at? The EBIDTA target of the business was 30 percent. A 30 percent mark-up on estimated costs was being used to estimate the price. Data verified the use of this thumb rule: average mark-up on costs for new proposals was 30 percent and 28 percent for repeat proposals.
With capacity utilization of only 30 percent and the business having a negative EBIDTA, this was illogical. Lower prices (if they led to a significant increase in volume) could lead to higher EBIDTA. Further increasing the bank of new RFPs would automatically increase the chances of getting repeat orders – where the WR was higher (55 percent). Repeat orders intrinsically were larger volumes, required lower R&D expenditures and have lower fixed costs – they are overall more profitable.
Lowering prices is, however, anathema to the finance/commercial departments in most companies unless costs are correspondingly lowered. A simple model was developed to help convince the project team and the company that lowering prices by 10 percent to 15 percent for a set of 15 proposals should be tried. The experiment was a great success. For a price decrease of 15 percent, and a corresponding increase in NWR from 18 percent to 33 percent, the revenue increased by 79 percent.
Further, the reduction in fixed cost would offset a large part of the price give away as shown in Table 3.
| Table 3: Lower Price-Higher Volume Model | ||
| Item | Current* | Model |
| Revenue | 143 | 256 |
| Fixed Costs | 40 | 40 |
| Percentage of Revenue (4/3)*100 | 28 | 16 |
| * General units of measure for purposes of case study | ||
The percentage of revenue reduced from 28 percent to 16 percent, or 12 percent. This offsets a large part of the price reduction.
The second countermeasure approach was to look at the high buffers used in cost estimation. To explore the extent of buffers in costs, past won orders were analyzed for the difference between actual and estimated costs. The results were a revelation:
New orders = 7.5 percent cost buffer
Repeat orders = 10 percent cost buffer
As a reminder, repeat orders are of large value and have a WR of 50 percent. The two combined factors – cost buffers and the reduction of fixed costs due to increased order volumes – were too powerful to resist testing for the model.
Step 5: Check the Result
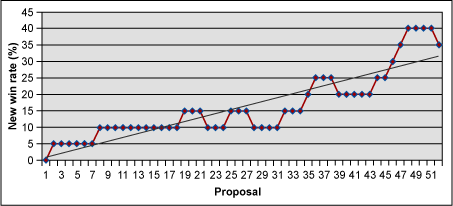
When the test was started NWR had fallen to zero. No order had been won for the past six months. The first six months of the test at reduced prices of 15 percent (shown in Figure 3) were a total success. The NWR climbed to 33 percent.

Step 6: Standardize Procedures
The process had been standardized as the project progressed. It was adhered to, initially, for six months after the project interventions while the model was being tested.
Step 7: Compile Quality Improvement Story
The improvement story was compiled and presented to senior management.
Conclusions
This case illustrates four qualitative principles of TQM exceedingly well.
Principle 1. A problem well defined is 50 percent solved. Form an initial problem statement. Here, the desire was to decrease the turnaround from sales query to proposal. The problem was identified as increasing the win rate of proposals submitted. The problem was further focused on increasing the WR of new proposals.
Principle 2. Find the true vital cause. This process more often than not needs careful facilitation. At the beginning, the vital cause is often hidden among the chorus of the widely accepted causes of the operating team’s experience and biases.
A price that was too high for the market was too simple an idea. In fact, a senior management employee was heard asking, “Why do we need a consultant to tell us that lowering the price will increase our WR? It is obvious – but we need to make money, also!”
Principle 3. Identifying the right solution(s) needs careful facilitation. The correct solutions are easily drowned out in the noise of ideas that arise from non-data-based, biased opinions.
For example, finance department and senior management employees will always be skeptical about reducing prices without first insisting on cost reductions. Headcounts, material efficiencies, etc. are the categories often blamed.
Principle 4. What cannot be measured cannot be improved. Developing insightful metrics is essential for success.
Defining the WR denominator as “per the last 20 proposals” instead of “proposals since the beginning of the financial year” led to a situation where the WR quoted was 10 percent at a specific point in time. It dropped, however, from 25 percent to almost zero, and in the last 3 months was zero. Sometimes the timeframe needs to be adjusted to see the problem.