Regression analysis is a widely used statistical technique; it helps investigate and model relationships between variables. It also uses a derived model to predict a variable of interest. The potential applications of regression analysis are numerous and can be found in almost every field, including economics, biology, management, chemical science and social science. Applying regression does require special attention from the analyst. Each process step – from model specification and data collection, to model building and model validation, to interpreting the developed model – needs to be carefully examined and executed. A small mistake in any of these steps may lead to an erroneous model. This article describes some common mistakes made in regression and their corresponding remedies.
Model Misspecification
The main intent of performing a regression analysis is to approximate a functional relationship between two or more variables by a mathematical model and to then use that derived mathematical model to predict the variable of interest. The first step in regression modeling is to specify the model – that is, define the response and predictor variables. Unfortunately, this is the step where it is easy to commit the gravest mistake – misspecification of the model.
Model misspecification means that not all of the relevant predictors are considered and that the model is fitted without one or more significant predictors. Just because a regression analysis indicates a strong relationship between two variables, they are not necessarily functionally related. Any two sequences, y and x, that are monotonically related (if x increases then y either increases or decreases) will always show a strong statistical relation. A functional relationship may not exist, though. For example, a strong statistical relation may be found in the weekly sales of hot chocolate and facial tissue. But this does not necessarily mean that hot chocolate causes people to need facial tissue or vice versa. If these two variables are modeled, they may show a strong statistical relationship but it would be a “nonsense” regression model. Listing the tissue and hot chocolate sales would likely exhibit a correlation because both tend to go down during summer and go up during winter. In this case, ambient temperature remains a hidden variable; a statistical model without considering ambient temperature is of no use.
To avoid model misspecification, first ask: Is there any functional relationship between the variables under consideration? To answer this question, analysts must rely on the theory behind the functional relationship that is to be modeled through regression. A proper understanding of the theory behind the functional relationship leads to the identification of potential predictors. From there, regression can be used to convert the functional relationship into a mathematical equation.
Unusual Observations
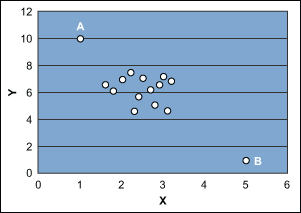
In the ordinary least square (OLS) method, all points have equal weight to estimate the intercept (βo) of the regression line, but the slope (βi) is more strongly influenced by remote values of the predictor variable. For example, consider the scenario shown in Figure 1. Points A and B play major roles in estimating the slope of the fitted model. The estimated slope of the fitted model will be different if points A and B are deleted.

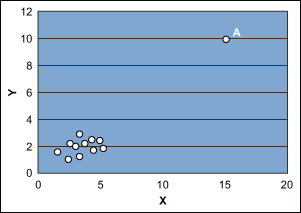
Another situation is shown in Figure 2, where point A is far away in the x-y plane and the fitted model would be based on two distinct pieces of information: 1) point A and 2) the cluster of remaining points. In such cases, the estimated slope of the fitted model is highly influenced by point A. In fact, without point A the estimated slope of the model might be zero.

In these cases, further analysis and the possible deletion of these outlying points may be required. Or it may be necessary to estimate the slope of the model with techniques other than OLS where these points carry less weight in determining slope. Practitioners can also look again at the theory behind the model to explore the possibility of adding other predictors.
Wrong Sign of Regression Coefficient
When using multiple linear regression, it may sometimes appear that there is a contradiction between intuition or theory and the sign of an estimated regression coefficient (β). For example, a theory or intuition may lead to the thought that a particular coefficient (β) should be positive in a particular problem. But after fitting the model there may be a negative sign for that coefficient. In such a scenario it is difficult for the analyst to explain the negative coefficient as the users of the model might believe the coefficient should be positive.
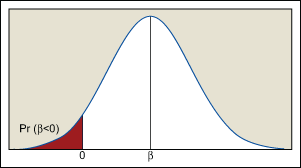
One of the factors that plays an important role in determining the sign of regression coefficients is the range of predictor variables. The variance of the regression coefficient (slope of regression line) is inversely proportional to the spread of the predictor variable. If all values of the predictor variable are close together, then the variance of the sampling distribution of the slope will be higher. In some cases the variance will be so high that an analyst will discover a negative estimate of a coefficient that is actually positive. This scenario is depicted in Figure 3, where the region shown in red shows the probability of the regression coefficient being negative where it should be positive.

In some cases an analyst can control the levels of the predictor variable and by increasing the spread of the predictor variable it is possible to reduce the variance of the regression coefficients. If the predictor variable covers too far a range, however, and the true relationship between the response and predictor is nonlinear then the analyst must develop a complex equation to adequately model the true relationship. It is important to note that increasing the range of the predictor variable beyond a certain level is not feasible given the practical constraints of the experiment. In general, regression analysis always involves a tradeoff among the precision of estimation, the complexity of a model and the practical constraints of the experiment to decide the range of predictor variables.
Interpreting Coefficient of Determination
R2 is often called the coefficient of determination; it is sometimes interpreted as a measure of the influence of predictor variables on response variables. A high R2 is considered proof that a correct model has been specified and that the theory being tested is correct. A higher R2 in one model is taken to mean that the model is better that another model with a lower R2. Unfortunately, all these interpretations are wrong.
R2 is simply a measure of the spread of points around a regression line estimated from a given sample; it is not an estimator because there is no relevant population parameter. All calculated values of R2 refer only to the sample from which they come. If the goal of an analyst is to get a big R2, then the analyst’s goal does not coincide with the purpose of regression analysis. R2 can be increased several ways (e.g., increasing the number of predictor variables), but such strategies will likely destroy most of the desirable properties of regression analysis. A high R2 value is not a sufficient criterion to conclude that the correct model has been specified and the functional relationship being tested is true.
R2 value can be useful, however, when comparing two different models with the same response variable but different predictor variables. The measure of R2, in this case, becomes a goodness-of-fit statistic, providing a rough way to assess model specification. For a single equation, R2 can be considered a measure of how much variability in the response variable has been explained by the regression equation fitted from a given sample.
How can you tell what good regression coefficients are and how can you tell how good a regression is as a whole? Standard errors are estimates of variance of regression coefficients across a sample. If they are small relative to the coefficients, then an analyst can be more confident that similar results would have emerged if a different sample were considered. Similarly, the use of an F-test will show if estimated regression coefficients are significant. R2 is associated with, but a poor substitute for, a test statistic.
There are also varieties of indirect uses of R2. It is often true that a high R2 results in small standard errors and high coefficients. Thus, a high R2 is good news for the analyst; R2 does not always mislead. The information provided by R2, however, is already available in other commonly used statistics, and these statistics are more accurate – the intent of regression is to model the population rather than sample.
Two More Rules
In addition to the more common conceptual mistakes that can be committed in regression analysis and the remedies already provided, there are two more general rules that apply to all types of statistical analysis:
- Concentrate on statistics that are meaningful and can be interpreted by non-statisticians.
- Try to use formal statistical models about which more is known. This will help the analyst to explain the practical significance of model parameters and the model will be more acceptable to the user.