
Quality function deployment (QFD) is a tool that appeals to many engineers and designers. It looks so nifty that they think, “There just has to be a place to use this.” Experience shows, though, that with its niftiness comes a certain risk connected with trying to apply QFD in places or in ways that it really does not fit.
QFD grew out of work at Bridgestone Tire and later Toyota to trace the treatment of customer-demanded quality attributes by the choices a supplier makes from design through component selection and process specification and control. Because this work dealt with manufactured products, many QFD textbook and training examples are cast in a manufacturing model.
Experience shows that the application to software requires more than a copy and paste of a manufacturing model. A number of key lessons have been learned through experience about the potentials and pitfalls of applying the QFD to software development.
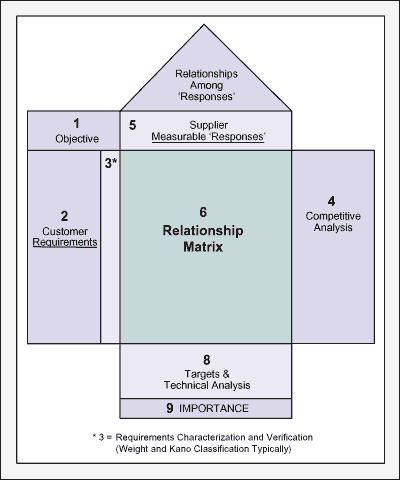
QFD, while highly customized, usually includes a relationship matrix (Figure 1) with a number of attached analysis sections (like Figures 3 and 5). At its core, QFD has these common features:
QFD Inputs and Starting Conditions
1. Each row describes a requirement; or what Dr. Yoji Akao, co-founder of QFD, called demanded quality. This is the voice of a relevant customer.
2. Each column describes a measurable response to the demanded quality – something that the solution provider would propose to drive and measure in order to satisfy requirements. This is the voice of a provider (e.g., design or construction or test), who will endeavor to address the requirements.
3. Each cell asks a team to evaluate a relationship between the intersecting row and column. Here is a place where QFD is especially interesting, and sometimes confusing. Depending on the objective of a particular QFD, and its place in the development cycle, the sense of this evaluation can be quite different.
QFD Outputs
1. An issues log. A team, with different insights into the QFD’s objectives, has a short but meaningful discussion to evaluate each relevant cell. This can be more important that the number or symbol that gets posted in the cell. The Issues Log captures action items, communication links, risks and opportunities, etc. The act of having this discussion checks and improves a team’s shared understanding about the requirements, measures and key issues, wherever the QFD occurs.
2. The evaluation values for each relevant cell. These values document the outcome of discussion, but they are not an end unto themselves. Some companies have moved QFD out of their development process because teams were “majoring in the minors” – spending hours on giant matrices just to get the values all filled in.
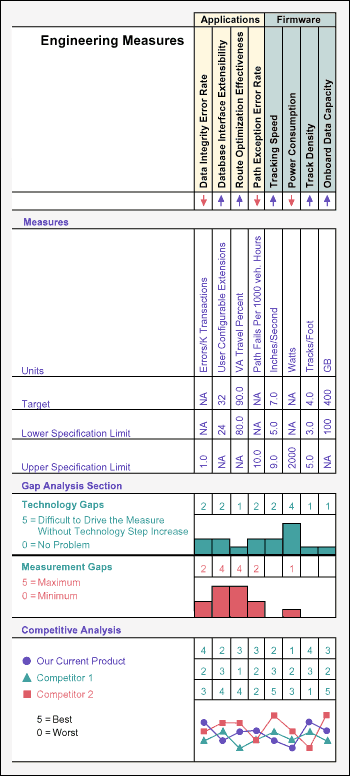
3. Column-wise gap analysis (Figure 6). This varies with different QFD tools, but some column analyses that have been found useful in software environments are:
a. Technology gaps
b. Measurement gaps
c. Competitive analysis gaps
Just those simple basics can give rise to QFDs that take on a unique flavor depending on where and how they are applied. To illustrate, here are two contrasting examples, the first with the familiar “How important is each measure” thrust, and the second with the objective of improving deployment through detailed design and integration. While the second application of QFD is much less common, it can be one of the most useful in software development, where integration risks are too well known.
QFD Application 1: How Important Is Each Measure?
This may be the most common QFD use. Measures, sometimes considered in connection with their direction of improvement, are evaluated in each cell in terms of “how important would that response to this (row’s) requirement be?” This can help a software development team in a number of ways:
- It checks a team’s shared understanding about what the requirements and measures really mean. This may sound simple, but the act of having a short discussion about the ways in which each prospective response could relate to each requirement uncovers differences of opinion and perspective across the team. Better for a team to struggle at this early stage to reach some common view of what’s meant by each requirement and measure.
- While the requirements should have already been characterized (e.g., Kano classifications) and prioritized before a QFD, the prioritization of measures during this kind of QFD can focus work on solution generation (stimulating extra creativity on the solution aspects connected with the most important measures).
- Prioritized measures suggest focus for measurement systems analysis and test. The most important measures should be done most carefully – using a measurement system that’s been most rigorously built and checked.
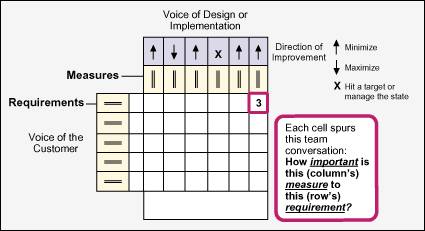
This QFD approach requires clarity at the start about whether or not a solution concept has been selected. If applied upstream of a solution concept, success with this method calls for a look-ahead to the number and kind of solution concepts that may be considered. If a team sees itself hedging evaluations with “it depends on which solution is selected,” then it probably isn’t a good use of time to step through this QFD. Alternately, if the evaluations can be done in a solution-free frame, then this QFD can improve understanding and inform solution generation ideas.
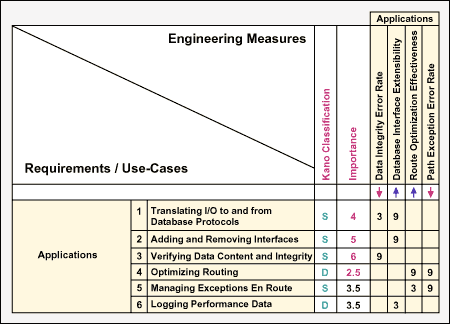
Figure 3 shows a few importance evaluations. As mentioned, the discussion about what the measures and requirements mean is often as important as the numeric evaluation scores. In a situation where there is already good clarity and shared understanding on the requirements and the measures – and especially if prioritization work has been done already on a per requirement and measure basis, this form of QFD is of questionable value. Before committing the time and resources to this grid, teams should look at what they stand to learn and understand how the results will be used. (The grid can be much larger in a real project.)
QFD Application 2: What Are Design and Integration Risks and Opportunities?
In a software project involving more than a few people, after a solution architecture has been selected, individuals and small teams set out to detail the design and construct their parts of the puzzle. While each of these units of work might be optimized enough unto itself, there is always some risk that the system will not integrate as planned. Interactions among the units may not be considered, or even visible, as part of a sub-team’s focused work. QFD can help here, but it calls for a different sense of the cell evaluations than the method described in Application 1.
Figure 4 outlines the sense of this application of QFD. Each column’s measure and direction of improvement is seen as a design endeavor, about to be launched. The question to consider in evaluating each cell is: “As we picture that measure being driven, in the context of our selected solution and in our development environment, to what extent do we anticipate: support and leverage (black numbers 1-9 in Figure 5) or risk and potential damaging effects (red numbers 1-9 in Figure 5) to each requirement?”
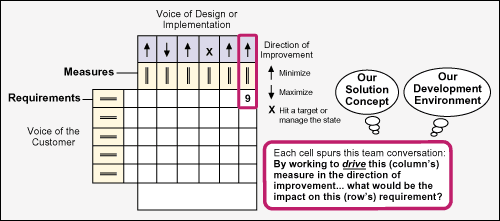
Figure 5 shows a few evaluations to illustrate how this can play out. In this example a firmware team (working on low-level robotics) and an applications team (developing the system level applications that ride the robotics) are checking their integration risks and opportunities early in design. The pink sections show that there are places where the measures being driven by one team may impact requirements that seem to be the purview of the other.
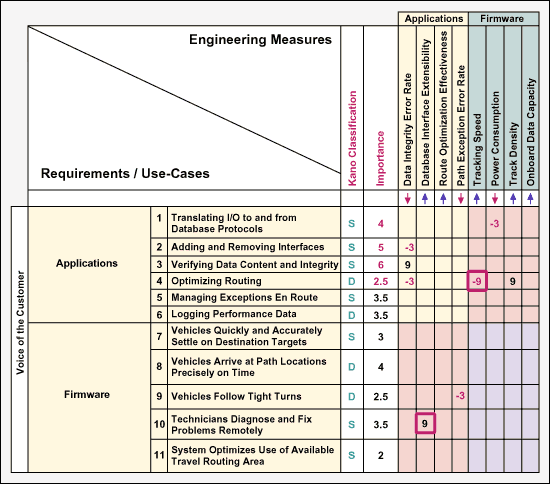
The highlighted “9” in Row 10 shows that ‘the plan for driving up database interface extensibility’ (that column’s measure in light of the solution concept) stands to significantly help the ability of “technicians to diagnose and fix problems remotely” (the row’s requirement). Flagging this now can help put in place the cross-team communication, results measurement and review attention to assure that this opportunity is realized.
The highlighted “-9” in Row 4 highlights a strong risk that the plan for driving up tracking speed (the row’s measure in light of the solution concept) may interfere with or compromise the application team’s ability to optimize routing. Flagging this now can put proper cautions, lines of communication and review attention in place to be sure the risk is minimized and managed.
This QFD can be seen as a mental experiment to anticipate and leverage opportunity and to reduce and manage integration risk. Done well, it can make it a much surer bet that when all the individuals and sub-teams come back together, things will integrate and play as planned.
The Value of Gap Analysis
In each of the kinds of QFD outlined here, and many others, it is useful to pursue the column-wise gap analysis (Figure 6 or Room 9 in Figure 1). A team assessing technology gaps is better prepared to overcome them or live with known limitations. Measurement gaps are common in software environments, and worth bringing to the surface early. It is useful to understand competitive gaps in all areas of product development.