
What is Gage R&R? Like it or not, any process will have variances and the potential for defects. Measurement error is unavoidable. There will always be some measurement variation that is due to the measurement system itself.
Most problematic measurement system issues come from measuring attribute data in terms that rely on human judgment such as good/bad, pass/fail, etc. This is because it is challenging for all testers to apply the same operational definition of what is “good” and what is “bad.”
However, such measurement systems are seen throughout industries. One example is quality control inspectors using a high-powered microscope to determine whether a pair of contact lenses is defect-free. Hence, it is important to quantify how well such measurement systems are working. To measure this, you’ll want to use Gage R&R.
Defining Gage R&R
The tool used for this kind of analysis is called Gage R&R. The R&R stands for repeatability and reproducibility. Repeatability means that the same operator measuring the same thing, using the same attribute, should get the same reading every time. Reproducibility means that different operators measuring the same thing, using the same Gage, should get the same reading every time.
Attribute Gage R&R reveals two important findings – the percentage of repeatability and the percentage of reproducibility. Ideally, both percentages should be 100 percent, but generally, the rule of thumb is anything above 90 percent is quite adequate.
Obtaining these percentages can be done using simple mathematics, and there is no need for sophisticated software. Nevertheless, Minitab has a module called Attribute Agreement Analysis (in Minitab 13, it was called Attribute Gage R&R) that does the same and much more, and this makes analysts’ lives easier.
Having said that, analysts need to understand what the statistical software is doing to make good sense of the report. In this article, the steps are reproduced using spreadsheet software with a case study as an example.
Steps to Calculate Gage R&R
Step 1
Select between 20 to 30 test samples that represent the full range of variation encountered in actual production runs. Practically speaking, if “clearly good” parts and “clearly bad” parts are chosen, the ability of the measurement system to accurately categorize the ones in between will not be tested. For maximum confidence, a 50-50 mix of good/bad parts is recommended. A 30:70 ratio is acceptable.
Step 2
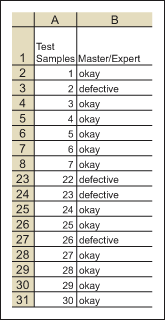
Have a master appraiser categorize each test sample into its true attribute category.
Step 3
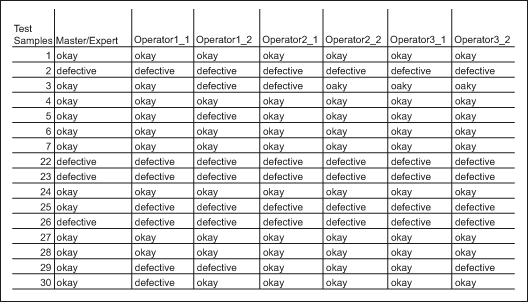
Select two to three inspectors and have them categorize each test sample without knowing what the master appraiser has rated them.
Step 4
Place the test samples in a new random order and have the inspectors repeat their assessments.
Step 5
For each inspector, count the number of times his or her two readings agree. Divide this number with the total inspected to obtain the percentage of agreement. This is the individual repeatability of that inspector (Minitab calls this “Within Appraiser”).
To obtain the overall repeatability, obtain the average of all individual repeatability percentages for all inspectors. In this case study, the overall repeatability is 95.56 percent, which means if the measurements are repeated on the same set of items, there is a 95.56 percent chance of getting the same results, which is not bad but not perfect.
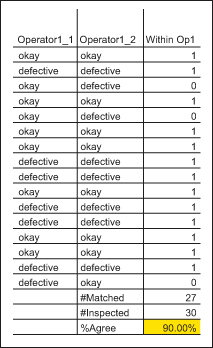
In this case, the individual repeatability of Operator 1 is only 90 percent. This means that Operator 1 is only consistent with himself 90 percent of the time. He needs retraining.
Step 6
Compute the number of times each inspector’s two assessments agree with each other and also the standard produced by the master appraiser in Step 2.
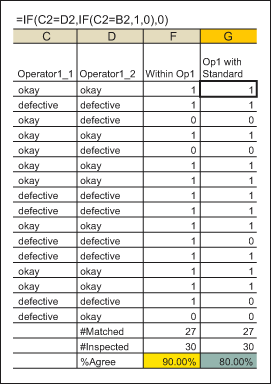
This percentage is called individual effectiveness (Minitab calls this “Each Appraiser vs. Standard”). In this case, Operator 1 agrees with the standard only 80 percent of the time. He needs retraining.
Step 7
Compute the percentage of times all the inspectors’ assessments agree for the first and second measurements for each sample item.
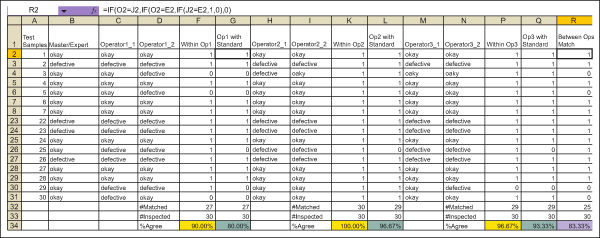
This percentage is the reproducibility of the measurement system (Minitab calls this “Between Appraiser”). All three inspectors agree with each other only 83.3 percent of the time. They may not be all using the same operational definition for pass/fail all the time or may have a very slight difference in interpretation of what constitutes a pass and a failure.
Step 8
Compute the percentage of the time all the inspectors’ assessments agree with each other and with the standard.
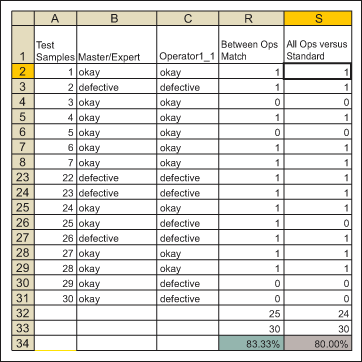
This percentage gives the overall effectiveness of the measurement system (Minitab calls this “All Appraiser vs. Standard”). It is the percent of time all inspectors agree and their agreement matches with the standard.
Minitab produces a lot more statistics in the output of the attribute agreement analysis, but for most cases and uses, the analysis outlined in this article should suffice.
So What If the Gage R&R Is Not Good?
The key in all measurement systems is having a clear test method and clear criteria for what to accept and what to reject. The steps are as follows:
- Identify what is to be measured.
- Select the measurement instrument.
- Develop the test method and criteria for pass or fail.
- Test the test method and criteria (the operational definition) with some test samples (perform a gage R&R study).
- Confirm that the Gage R&R in the study is close to 100 percent.
- Document the test method and criteria.
- Train all inspectors on the test method and criteria.
- Trial the new test method and criteria and perform periodic Gage R&Rs to check if the measurement system is good.
- Launch the new test method and criteria.
Other Concepts to Consider
Measurement system analysis is a fairly heady subject matter as a whole. However, understanding the core concepts behind it is a great way to increase your productivity and efficiency across the board. with that in mind, I recommend glancing over our guide on how to master Gage R&R fully. It does touch on concepts featured in this article but goes more in-depth on how it applies to your organization.
Further, you might want to learn about verification and validation. These are two commonly misunderstood concepts when it comes to MSA, understanding how they differ and where they are applicable is of critical importance.
Tying It All Together
Improving any part of your process can be an undertaking. The simple fact is you’re going to have defects and variations when looking at a process. However, utilizing something Gage R&R calculations is a proven way of testing for potential errors in your projects. Mastering it is a great way of bolstering your MSA workflow.