The application of Six Sigma to marketing should be the most obvious use in the world. Where else does there exist such a direct connection between the wants and needs of the customer and the products or services a company offers? However, at first glance, there would seem to be very little hard reliable data on the vital Xs that influence the process of making a decision to buy. This makes it appear that marketing projects, while good for the business, lack the statistical rigor associated with Six Sigma.
Of course, that is not true. Design of experiments (DOE), known in marketing literature as conjoint analysis, is the most powerful statistical technique for making the connection between the psychology of the customer’s decision-making process and the product or service being offered. When applied well, it can allow a company to gain an almost psychic insight into the vital Xs influencing a customer’s buying decision.
Marketing Problems
In the end, the goal of marketing is to be able to predict the future market share, profitability or net sales for an offering. This will allow a company to:
- Predict customer buying behavior
- Increase customer retention
- Determine the trade-off strategy during contract negotiations
- Determine competitive pricing
- Forecast sales
- Manage brand equity
- Design product elements
- Determine price sensitivity
- Predict and minimize customer switch rates
- Determine best market position for new product introduction
- Predict and optimize response rates to advertising campaigns with respect to content construction and distribution channel mix.
The Big Y and Unknown Xs
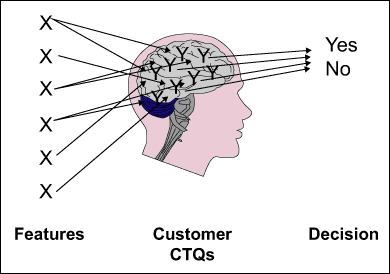
During the decision-making process, the customer will choose either to accept or reject a company’s offering. There needs to be a way of determining the relationship between the factors in the customer’s head and the final decision. It is a bit difficult because the customer will usually be unaware of the complex psychological processes going on behind their own decision-making process. An acceptable fallback position is to develop a predictive model involving observable characteristics of the offering (Figure 1).

Businesses frequently make the mistake of assuming that customers make decisions based on the same criteria that they usually do – cost. Customers make decisions based on value – a complex interplay of sociological and psychological factors. As an example, would someone consider paying an extra $10 per month in taxes to support a youth-oriented, non-profit recycling program in their neighborhood? Clearly, the most cost-effective solution would be to reject the tax, but a person might consider paying for a variety of reasons. This separation of critical-to-quality elements (CTQs) for the internal customer (cost) and external customer (value) will allow a company to determine the best offering to optimize both CTQs at the same time.
Six Sigma projects usually concentrate on only a single Y to simplify the analysis. Even though there is a complex mapping of Xs to Ys in the mind of the customer, here the focus will be on the single Y of the yes-or-no decision. This discrete measurement is not as useful as a quantitative measure, so data will be gathered to drive into the multiple Ys in the customer’s head by asking them to make decisions given some carefully constructed choices. When this is done well, it will allow the derivation of a predictive model for the decision process.
Rating Factors in Decision Making
Customers are poor at determining ratings on an absolute scale, but very good at making ratings based on a relative scale. When citizens in the recycling example above considered paying a $10 tax for a recycling program, they made the final choice based on a complex weighting of their present taxes, their finances, whether there were employment opportunities for youth in their community, their own position on reduction of household waste, and their social conscience. They balanced these factors against their confidence that $10 per month could be used to implement a workable program in their neighborhood. This was done in light of existing initiatives for youth employment and garbage collection. A customer’s decision to accept or reject an offering is done in a similar complex and poorly understood process.
The conjoint study or DOE is conducted in stages similar to the phases of a DMAIC (Define, Measure, Analyze, Improve, Control) project. The final design and execution of the study depends on the stimulus construction, data collection, model type, measurement scale, statistical data analysis and model construction, and stimulus analysis. The example below is a fairly simple one to determine the value customers will assign to the functions of a cellular phone.
The marketing department’s mission is to design a product placement for cell phone packages targeted at high school students nearing graduation. Consumers would like to have a package with the best value, the marketing department would like to design an advertising campaign which will convince consumers that the product will satisfy their needs. To keep this example simple, assume the customer base is a single, homogeneous group with a survey sample size of three, the design of the survey will have four factors at two levels each, and the design will have two replicates.
Brainstorming Xs and Choosing Factor Levels
The selection of the Xs for this study can proceed using the brainstorming tools used in DMAIC’s Measure phase. Fishbone diagrams can be used to tabulate all the possible factors that the marketing department would like to investigate. The “effect” in the fishbone diagram should be “a buying decision.” The project could be scoped to include the features of the offering or expanded to include elements of the form of the presentation. The number of factors should be limited to about a dozen. This can be done by rescoping the project, or conducting a short customer survey to determine the most important factors in making a buying decision.
The levels used for each factor should be chosen to cover the range of realistic choices. The number of factors could be extended and the size of the study increased, but in this example only four will be used. The factors and levels are shown in Table 1.
| Table 1: Factors and Levels | ||
|
Factor |
High |
Low |
| Hardware Discount | $150 with three-year contract | $100 with two-year contract |
| Call Display | None | $5 per month |
| Text Messaging | 15 cents per message | $10 per month unlimited |
| Multimedia Charges | Five free mutimedia attachments per month, 75 cents thereafter |
50-cent charge per attachment |
Collecting Data Via Card Sorting
Customers must rate the features in some way. In this case, eight cards were constructed with lists of multiple configurations of options on each. The design was a Resolution IV, four-factor DOE with six replicates. The cards were given to customers and they were asked to sort them in decreasing order of preference. The highest-rated choice was assigned 1, while the lowest-rated choice was assigned 8 (Table 2). Customers could have been asked to rate each offering on a 10-point scale, but sorting the cards forces the customer to make complex tradeoffs and eliminates a large number of ties. The forced ranking from 1 to 8 increases the discrimination of the measurement. Each customer was asked to repeat the card sort. Data was entered into the worksheet of a statistical software application for analysis (Minitab, in this case).
| Table 2: Configurations and Multiple Ratings | |||||||
|
|
Hardware |
Call |
Text |
Multimedia |
Rating |
Rating |
Rating |
|
1 |
$150 with 3-year contract |
None |
15 cents/message |
5 free/month, 75 cents thereafter |
5, 5 |
6, 5 |
5, 6 |
|
2 |
$100 with 2-year contract |
None |
15 cents/message |
50 cents/attachment |
6, 7 |
3, 6 |
6, 4 |
|
3 |
$150 with 3-year contract |
$5/month |
15 cents/message |
50 cents/attachment |
2, 4 |
2, 2 |
1, 1 |
|
4 |
$100 with 2-year contract |
$5/month |
15 cents/message |
5 free/month, 75 cents thereafter |
1, 3 |
4, 1 |
2, 2 |
|
5 |
$150 with 3-year contract |
None |
$10/month unlimited |
50 cents/attachment |
8, 6 |
8, 8 |
7, 7 |
|
6 |
$100 with 2-year contract |
None |
$10/month unlimited |
5 free/month, 75 cents thereafter |
7, 8 |
7, 7 |
8, 8 |
|
7 |
$150 with 3-year contract |
$5/month |
$10/month unlimited |
5 free/month, 75 cents thereafter |
3, 1 |
1, 3 |
3, 3 |
|
8 |
$100 with 2-year contract |
$5/month |
$10/month unlimited |
50 cents/attachment |
4, 2 |
5, 4 |
4, 5 |

Analyzing Data/Interpreting Results
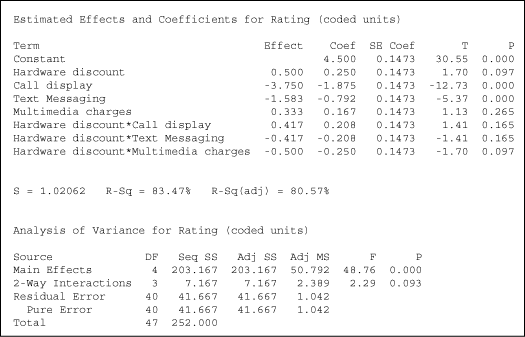
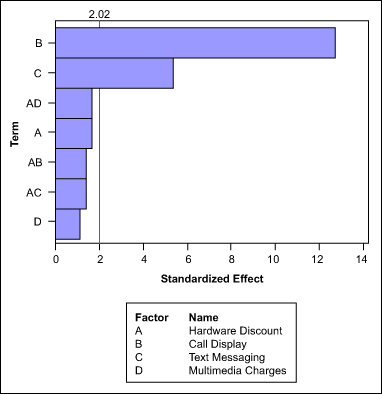
The analysis of variance (ANOVA) printout from Minitab (Figure 2) shows that this sample of customers would prefer to pay an extra $15 for call display and unlimited text messaging. A model using only these two factors explains about 80 percent of the variation in the survey data (Figure 3).

The sample was composed of customers whose cell phone was their primary telephone and was always turned on. When the analysis was finished, the customers who took the survey were interviewed, resulting in the following findings:
- Call display (the highest-rated factor) was important in order to screen calls.
- Text messaging was used in very noisy and in very quiet environments. These were usually dark places, requiring a well-lit, visible display.
- The customers’ usage patterns required a large number of messages and they were interested in a fixed cost for budgeting.
- The interaction effect between hardware discount and multimedia charges was not significant. But the user group said their choice for multimedia plan option depended on the choice of cell phone hardware.
- Users were more likely to incur extra charges associated with sending photographs and multimedia attachments when they considered buying a more expensive phone.
- The more expensive phones were more attractive with the $150 discount.
- A selling opportunity for voice mail was identified.
Conclusions: Powerful Tool for Predicting Behavior
It was interesting that the survey provided insight into the customer behavior without having to ask detailed questions on features, usage patterns and usage types. It is a far more reliable and powerful technique than typical voice of the customer surveys. Conducting the survey took less than 30 seconds per trial.
This is a fairly simple example, but it should illustrate the merits of further investigating the applications of DOE/conjoint analysis for Six Sigma projects in marketing. A quantitative predictive model that captures the customer decision-making process is a powerful marketing tool for predicting customer behavior.
Additional Resources
- VOC/Conjoint Analysis: Actionable Customer Segmenting” by Marco Folpmers
- “Conjoint Analysis Tutorial” by Scott M. Smith
- “Conjoint Predictions: 15 Year Later,” a follow-up on the 1972 article “Condominium Design and Pricing: A Case Study in Consumer Trade-off Analysis” by John A. Fiedler
- “Boost Your Marketing ROI with Experimental Design” by Eric Almquist and Gordon Wyner