Attribute control charts arise when items are compared with some standard and then are classified as to whether they meet the standard or not. The control chart is used to determine if the rate of nonconforming product is stable and detect when a deviation from stability has occurred. The argument can be made that a LCL should not exist, since rates of nonconforming product outside the LCL is in fact a good thing; we WANT low rates of nonconforming product. However, if we treat these LCL violations as simply another search for an assignable cause, we may learn for the drop in nonconformities rate and be able to permanently improve the process.
The np Chart can be used for the special case when the subgroups are of equal size. Then it is not necessary to convert nonconforming counts into the proportions phat(i). Rather, one can directly plot the counts x(i) versus the subgroup number i.
Steps in Constructing an np Chart
- Determine the size of the subgroups needed. The size, n, has to be sufficiently large to have defects present in the subgroup most of the time. If we have some idea as to what the historical rate of nonconformance, p, is we can use the following formula to estimate the subgroup size:
n=3/p
- Find find pbar.
- Find the UCL and LCL where:
- Plot the centerline pbar, the LCL and UCL, and the process nonconforming
counts, the x(i)’s. - Interpret the control chart. Only if a point is outside the +/- 3 sigma range is the process considered to be out of control.


Example:
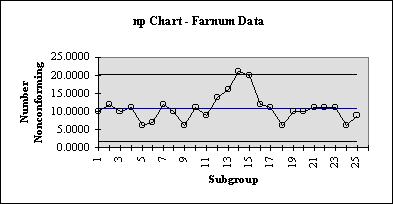
Farnum Example:
data is from Farnum (1994):
Modern Statistical Quality Control and Improvement, p. 245

			Sample
Day	Non-conforming	Size
1	10		100
2	12		100
3	10		100
4	11		100
5	6		100
6	7		100
7	12		100
8	10		100
9	6		100
10	11		100
11	9		100
12	14		100
13	16		100
14	21		100
15	20		100
16	12		100
17	11		100
18	6		100
19	10		100
20	10		100
21	11		100
22	11		100
23	11		100
24	6		100
25	9		100

Calculations:

PBAR =	0.1088
CL =	10.8800

UCL =	n*pbar + 3*sqrt(n*pbar*(1-pbar))

LCL =	n*pbar + 3*sqrt(n*pbar*(1-pbar))

Day	CL	UCL		LCL		NonConforming
1	10.8800	20.22164354	1.538356462	10.0000
2	10.8800	20.22164354	1.538356462	12.0000
3	10.8800	20.22164354	1.538356462	10.0000
4	10.8800	20.22164354	1.538356462	11.0000
5	10.8800	20.22164354	1.538356462	6.0000
6	10.8800	20.22164354	1.538356462	7.0000
7	10.8800	20.22164354	1.538356462	12.0000
8	10.8800	20.22164354	1.538356462	10.0000
9	10.8800	20.22164354	1.538356462	6.0000
10	10.8800	20.22164354	1.538356462	11.0000
11	10.8800	20.22164354	1.538356462	9.0000
12	10.8800	20.22164354	1.538356462	14.0000
13	10.8800	20.22164354	1.538356462	16.0000
14	10.8800	20.22164354	1.538356462	21.0000
15	10.8800	20.22164354	1.538356462	20.0000
16	10.8800	20.22164354	1.538356462	12.0000
17	10.8800	20.22164354	1.538356462	11.0000
18	10.8800	20.22164354	1.538356462	6.0000
19	10.8800	20.22164354	1.538356462	10.0000
20	10.8800	20.22164354	1.538356462	10.0000
21	10.8800	20.22164354	1.538356462	11.0000
22	10.8800	20.22164354	1.538356462	11.0000
23	10.8800	20.22164354	1.538356462	11.0000
24	10.8800	20.22164354	1.538356462	6.0000
25	10.8800	20.22164354	1.538356462	9.0000
np – Chart:
