Tag: Hypothesis Testing

How Statistical Hypothesis Testing Can Help Organizations Make Better Business Decisions
Published:In today’s data-driven world, organizations across industries are inundated with information. Transforming this data into actionable insights requires robust analytical tools, one of which is statistical hypothesis testing. This method enables businesses to make decisions based on data rather than intuition, significantly reducing risks and enhancing operational efficiency. This article explores the concept […]
Read more »
The Role of the Anderson-Darling Test in Assumption Testing
Published:Is your data normal? If not, will that be a problem? It might be, since data normality can be important when using certain statistical tools to make your business decisions.
Read more »
Z-Score: A Handy Tool for Detecting Outliers in Data
Published:Some say that Z is the sign of Zorro (Spanish for fox), the fictional sword-wielding masked vigilante who defended and helped the poor. In statistics, it is something different. In statistics, z usually refers to the standardized score or z-score of a data point in a normal distribution. The z-score measures the number […]
Read more »
Exploring the Benefits of Autocorrelation in Time Series Analysis
Published:To optimize the benefit of your forecasting, you would like your time series values to be independent. Unfortunately, sometimes your values are correlated. This autocorrelation will have an impact on your ability to interpret what the data is telling you. Autocorrelation refers to the correlation between a time series variable and its lagged […]
Read more »
Leveraging Key Process Input Variables for Success
Published:Complex products and processes can often yield significant variation in output, with resultant poor customer satisfaction, especially when process inputs are not well controlled. By understanding and controlling our key process input variables, we have the perfect approach to keep output variation in check.
Read more »
Making Sense of the Two-Proportions Test
Updated:Consider a production process that produced 10,000 widgets in January and experienced a total of 100 rejected widgets after a quality control inspection (i.e., failure rate = 0.01, success rate = 0.99). A Six Sigma project was deployed to fix this problem and by March the improvement plan was in place. In April, the process […]
Read more »
Exploring the Null Hypothesis: Definition and Purpose
Published:The null hypothesis, written as Ho is a subset of the larger topic of Hypothesis Testing. The null hypothesis is a statement about a specific condition of your data and allows you to draw important conclusions about that data.
Read more »
Mastering the T-Statistic: Tips and Tricks
Published:You may think turnaround time has decreased from your baseline as a result of a process improvement. But has it really? The t statistic is one way to find the answer to that question.
Read more »
Making Sense of the Two-Sample T-Test: Supercharge Your Hypotheses Tests
Updated:The two-sample t-test is one of the most commonly used hypothesis tests in Six Sigma work. It is applied to compare the average difference between two groups. You use it to determine if the difference is significant or if it is due instead to random chance. It helps to answer questions like whether the average […]
Read more »
Null Hypothesis vs. Hypothesis: What’s the Difference?
Updated:Null hypothesis vs. hypothesis, which is the right choice? When you get into the different methods of analyzing data, there is no shortage of tools at your disposal. Understanding the difference between a null hypothesis and a hypothesis can make or break your testing and analysis stages. Let’s dive into both of these tools and […]
Read more »
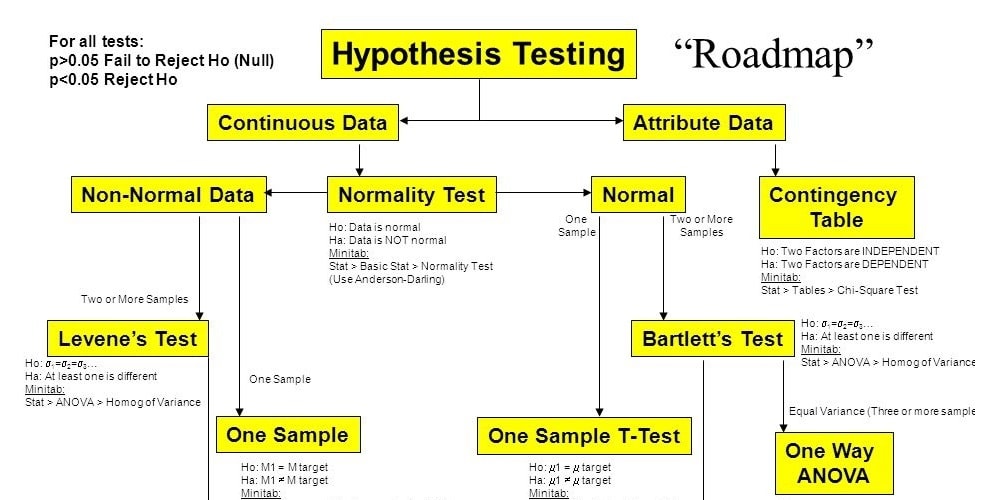
The History of the Hypothesis Testing Flow Chart
Published:Here’s the story about how the hypothesis testing flow chart was developed in Barcelona in 1995, as told by Mike Carnell.
Read more »