Tag: distribution

Normal Distribution: Definition, Characteristics, and Benefits
Published:The word Normal generally has a positive connotation. When applied to statistics, the term Normal Distribution has essentially the same effect. Let’s see why.
Read more »
Tips for Recognizing and Transforming Non-Normal Data
Published:Six Sigma professionals should be familiar with normally distributed processes: the characteristic bell-shaped curve that is symmetrical about the mean, with tails approaching plus and minus infinity (Figure 1). When data fits a normal distribution, practitioners can make statements about the population using common analytical techniques, including control charts and capability indices (such […]
Read more »
Platykurtic Distribution: Working Beyond Normality
Published:Not all your data will have a normal distribution. Sometimes, the curve is taller or shorter than a theoretical normal distribution. Does that mean you have a problem? We can answer that question by learning a little bit more about kurtosis and the platykurtic distribution.
Read more »
Resource Page: A Primer on Non-normal Data
Published:The distribution of data can be categorized in two ways: normal and non-normal. If data is normally distributed, it can be expected to follow a certain pattern in which the data tend to be around a central value with no bias left or right (Figure 1). Non-normal data, on the other hand, does not tend […]
Read more »
Getting the Most out of a Capability Analysis
Published:The process capability indices Pp and Cp describe how closely a process can operate within its specification limits. Many articles describe the difference between Pp and Cp simply: one is short term, one is long term. Moving beyond such a description, this article focuses on the untapped power of capability analysis and shows you how […]
Read more »
Pepsi Installs New Warehouse Automation Equipment to Reduce Costs
Published:In a move to reduce waste and warehousing costs under its Six Sigma plan, Pepsi Beverages Co. has installed an automated storage and retrieval system (AS/RS) and warehouse control system at its plant in Tampa, Fla., USA.
Read more »
Better Project Management Through Beta Distribution
Published:As a Six Sigma professional responsible for managing projects, have you ever been asked the following questions? When do you reasonably expect to complete your project? What’s the probability of completing the project on time or on a given date? Which activities on the critical path should you focus your attention on to meet the […]
Read more »
Piggybacking Air Filters to Save Shipping Costs
Published:Cummins operates three plants San Luis Potosi, Mexico, which produce and ship products daily to distribution centers in the United States. These plants produce systems such as reconditioned engines, alternators, and filtration and exhaust systems. Two of the three plants were looking for ways to reduce the high costs of trucking the products, so Rebecca […]
Read more »
Part 1 of a Finished Goods Supply Chain Case Study: Moving Products from Depot to Distributor
Published:The “Great Indian Bazaar” – the rapidly growing and evolving Indian retail market – presents special and daunting distribution challenges for fast-moving consumer goods (FMCG) products, such as groceries, toiletries and other items that are used up and must be replaced in a short amount of time. For a typical producer, about 100 stock keeping […]
Read more »
Estimation Method Helps Analysis of Truncated Data Sets
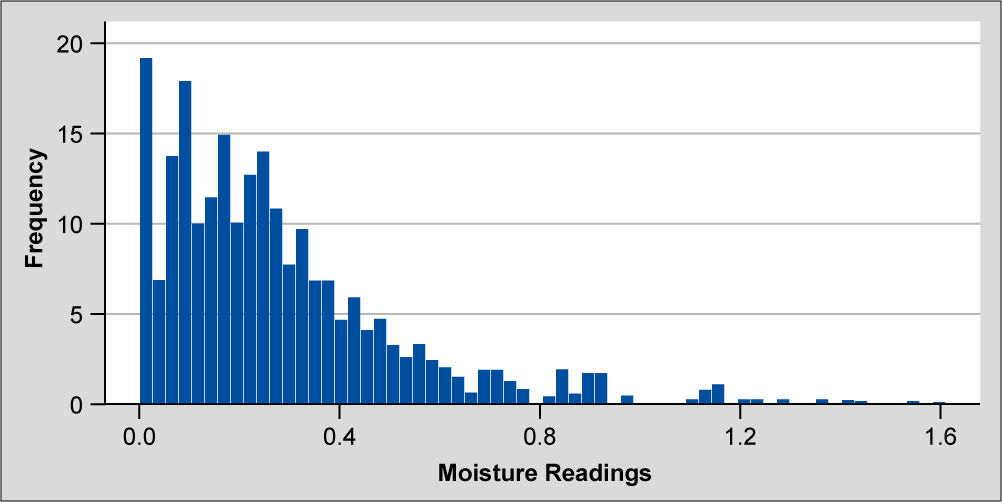
Published:A data set with a physical limit – such as time, which has a lower bound of zero – often cannot be transformed using the usual tools for non-normal data. To determine process capability and perform further statistical analysis, use the standard deviation calculated as if the data were not truncated, along with a correction factor.
Read more »
Understanding Statistical Distributions for Six Sigma
Published:Many consultants remember the hypothesis testing roadmap, which was a great template for deciding what type of test to perform. However, think about the type of data one gets. What if there is only summarized data? How can that data be used to make conclusions? Having the raw data is the best case scenario, but […]
Read more »