Tag: discrete data

Tips for Interpreting Discrete Data: Understanding Category Variables
Published:Understanding discrete data will give you yet another tool for understanding your process measure or outcome. This article will explain the tips and traps of using discrete data in process improvement.
Read more »
Avoid Two Common Mistakes in Measurement System Analysis
Updated:Measurement system analysis (MSA) determines whether the measurement system is adequate and confirms that significant error is not introduced to the true value of a process characteristic. MSA is the one of the most misunderstood and underused concepts in Six Sigma. This article highlights two of the common mistakes made during the study and explains […]
Read more »
Resource Page: A Primer on Non-normal Data
Published:The distribution of data can be categorized in two ways: normal and non-normal. If data is normally distributed, it can be expected to follow a certain pattern in which the data tend to be around a central value with no bias left or right (Figure 1). Non-normal data, on the other hand, does not tend […]
Read more »
Making Sense of the Binary Logistic Regression Tool
Published:In some situations, Six Sigma practitioners find a Y that is discrete and Xs that are continuous. How can a regression equation be developed in these cases? Black Belt training indicated that the correct technique is something called logistic regression but this tool is often not well understood. An example about a well-known space shuttle […]
Read more »
Analytical Treatment of Discrete Ordered Category Data
Published:Ordered category data is discrete data representing appraiser or client perception against a rating scale such as a survey or questionnaire. Black Belts learning to apply the Six Sigma methodology to ordered category data are traditionally taught analytical methods that include normal and Poisson distributions. This is probably due to Six Sigma’s beginnings in manufacturing. […]
Read more »
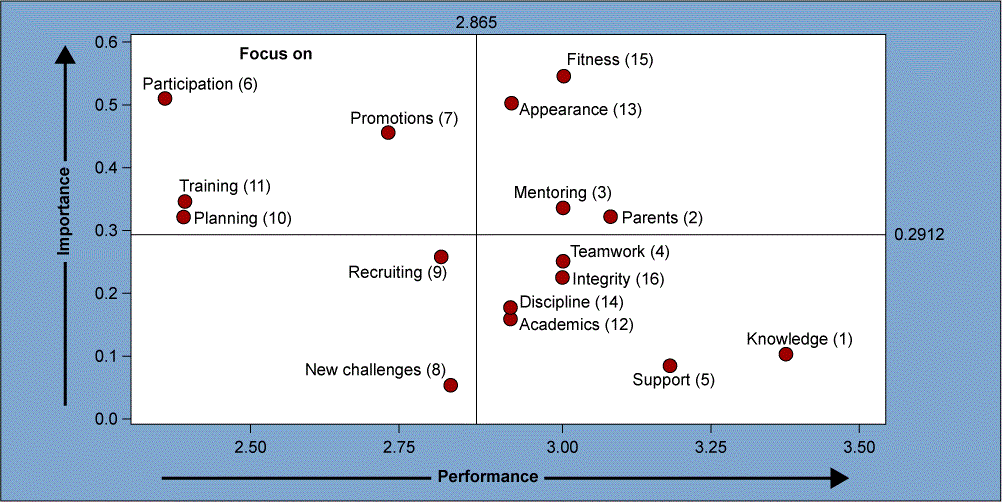
Using Quadrant Plots to Improve Program Performance
Published:When assessing areas of satisfaction within a company’s improvement program, a quadrant plot comparing importance versus performance of those areas can visually show Six Sigma project leaders where they should focus their efforts.
Read more »
Challenges of Discrete and Attribute Data Measurement
Published:More than ever, companies today realize the importance of measurement – everything from measuring performance to measuring gap closure – in order to achieve goals. Measurement is the process of estimating the ratio of the magnitude of a quantity to a unit of the same type. A measurement is the result of such a process, normally expressed […]
Read more »