A variety of analyses can be done during the Analyze phase of a Six Sigma DMAIC (Define, Measure, Analyze, Improve, Control) software project with data from Fagan-style inspections. These analyses suggest possible implications when considering Improve activities. Analyses used here are based on a real situation and the conclusions drawn are valid in that situation, but are not necessarily applicable to other organizations. These analyses are done with various subsets of the data and are hence not directly comparable to one another.
Measure Phase Data
Table 1 provides a portion of the inspections data collected during the Measure phase. This data was used in the analyses that follow.
| Table 1: Inspections Data | ||||||
| Work Product Type |
4GL |
4GL |
4GL |
4GL |
4GL |
4GL |
|
Appraised Size |
73 |
67 |
116 |
122 |
172 |
225 |
|
Number of Participants |
4 |
4 |
4 |
4 |
4 |
5 |
|
Code Was Tested |
True |
True |
True |
True |
True |
True |
|
Rework Hours |
2.0 |
0.65 |
2.0 |
6.23 |
0.18 |
0.96 |
|
Total Appraisal Hours |
11.5 |
11.2 |
13.5 |
7.3 |
9.62 |
13.2 |
|
Major Defects |
3 |
1 |
7 |
4 |
1 |
2 |
|
Major Defects Per Hour |
0.261 |
0.089 |
0.519 |
0.548 |
0.104 |
0.152 |
|
Major Defects Per Size |
41.096 |
14.925 |
60.345 |
32.787 |
5.814 |
8.889 |
|
Language |
4GL |
4GL |
4GL |
4GL |
4GL |
4GL |
|
Defect Severity |
Minor |
Major |
Minor |
Major |
Minor |
Minor |
|
Defect Type |
Documentation |
Checking |
Data |
Interfaces |
Interfaces |
Documentation |
Defect-Type Distributions
Objective of this analysis is to determine which, if any, defect types are represented in significantly different proportions by language, and within language, by project type. Minitab basic statistics > 2 proportions was used to develop Tables 2 and 3. Entries in the tables with p-values < .05 are significantly different between the populations compared.
| Table 2: Java Versus 4GL | |||||
|
Defect Type |
Java (n = 498) |
4GL (n = 1,342) |
p-Value |
||
|
Function/Algorithm |
106 |
21% |
574 |
43% |
0.000 |
|
Data/Relationships |
56 |
11% |
184 |
14% |
0.159 |
|
Documentation |
19 |
4% |
169 |
13% |
0.000 |
|
Object/Program Structure |
88 |
18% |
139 |
10% |
0.000 |
|
Performance/Scalability |
82 |
16% |
66 |
5% |
0.000 |
|
Standards |
56 |
11% |
51 |
4% |
0.000 |
|
Checking |
52 |
10% |
112 |
8% |
0.180 |
|
Interfaces |
30 |
6% |
38 |
3% |
0.006 |
| Table 3: Transactional Applications Versus User Interfaces | |||||
|
Defect Type |
Trans. (n=436) |
U.I. (n=225) |
p-Value |
||
|
Function/Algorithm |
191 |
44% |
71 |
32% |
0.002 |
|
Data/Relationships |
33 |
8% |
14 |
6% |
0.511 |
|
Documentation |
82 |
19% |
37 |
16% |
0.446 |
|
Object/Program Structure |
50 |
11% |
51 |
23% |
0.000 |
|
Performance/Scalability |
13 |
3% |
25 |
11% |
0.000 |
|
Checking |
34 |
8% |
8 |
4% |
0.017 |
|
Interfaces |
19 |
4% |
10 |
4% |
0.959 |
Inspection of Tested Versus Untested Code
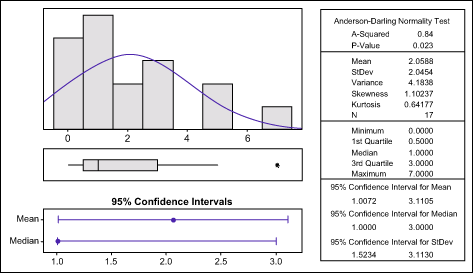
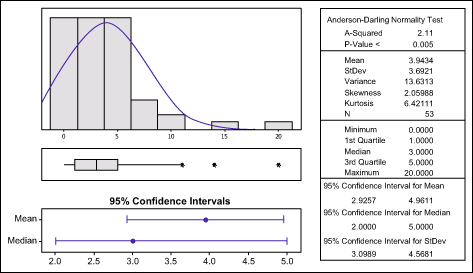
Inspections of untested code find twice as many defects as in tested code – the difference is statistically significant. Note, however, that the cost to find and fix a defect by inspection was less than half of the cost of testing, even if the code had been tested prior to inspection.


Mann-Whitney Test and Confidence Interval:
Code Defects Count FALSE, Code Defects Count TRUE
(Minitab Printout)
Number of Inspectors

Implications for the Improve Phase
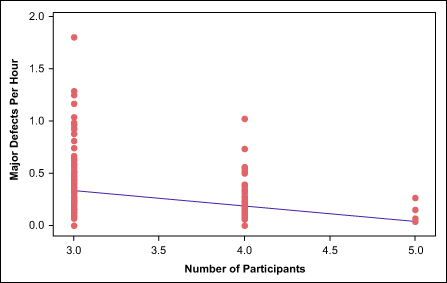
- Number of inspectors: In this situation, the conventional wisdom – based on Fagan’s data – is clearly not valid (i.e., four inspectors are not more cost effective than three). Hence, reduce the number of participants per inspection to three and use the resultant savings to evaluate alternative allocation of that effort to:
- More inspections (data collected so far does not indicate that a sufficient percentage of code has been inspected to reach diminishing returns); or
- More detailed design (see next item).
- 4GL: Explore methods to prevent function/algorithm defects. Discussion with the development team suggests insufficient detail in design and requirements documents may be the most significant root cause. Conduct a pilot effort to evaluate cost/benefit of additional design effort.
- Java: As defect types are more evenly distributed compared to 4GL, a more broadly based educational effort may be more effective than a focus on particular defect types. Examination of a cross section of defects suggests they predominately originate in code and are not related to design or requirements.
- Focus on untested code: If, as in most cases, effort allocated to inspections is severely limited, then priority should be given to untested code. However, a pilot program to test the cost-benefit ratio of allocating a significantly higher percentage of total effort to inspections is clearly indicated. Most projects in this sample allocated 5 percent to 10 percent of total construction effort to inspections. In most instances, 30 percent to 40 percent of total development effort is allocated to testing.
Other Analyses
Many other analyses can be performed when data is available. One high potential area is to examine the differential effectiveness of different appraisal methods (design and code inspections, unit, system and acceptance testing) in terms of the types of defects most efficiently found by each method.
