
One of the biggest challenges in any Six Sigma order fulfillment project is the scoping. Having clear boundaries on what aspects will and will not be covered in the project is paramount to its success. Scoping sometimes indicates that a single Black Belt project could overwhelm the Black Belt leader. With too large a playing field, he or she may not even be able to figure out where to begin.
An order fulfillment project can best be understood with a case study of an effort to reduce delivery time. The particular order fulfillment process explored is that of an information technology (IT) company.
The functions within the order fulfillment process for this company include:
- Receive and document purchase order
- Allocate and organize materials
- In-house production
- Post goods inventory
- Truck out/flight out
- Customs clearance
- Delivery to customer
Beginning the Scoping Process
For a customer, the primary metric to be considered is turnaround time – the time from when an the order is entered until the goods are delivered. In this case study, it is called order cycle time.
It also is important to have a metric that describes the turnaround time (TAT) for each function. This was necessary to break down the Black Belt project into several other Green Belt projects with each carrying its own set of metrics.
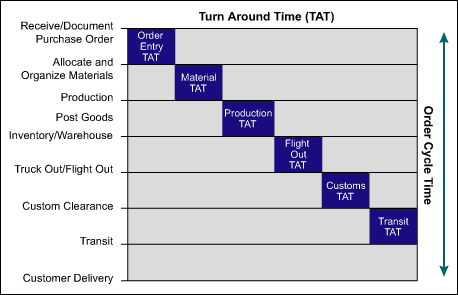
Simply put, Figure 1 can be stated in this equation:
Y = f(X1, X2, X3, X4, X5, X6)
or
Delivery Time = f(TATOrder Entry ,TATMaterial Allocation ,TATProduction ,TATTruck Out ,TATCustoms ,TATTransit )
The various stages, then need to be prioritized in order to allocate resources and set an order of progress. The idea is to start a DMAIC project based on the six TATs with a clear scope.
Interpreting Cycle Time Data
In any cycle time project, interpretation of data plays an important role. While the average delivery time establishes performance, it may not be a wise choice since the average does not take into consideration all values. Most often, the need for an improvement project comes when complaints of late deliveries are received come from customers who constitute a minor portion of data points falling at the extreme set. These customer complaints may never get addressed unless the average is hovering at 99 percent or more.
The best way to measure TAT for orders when the order count is large is to use a percentile measure. When data on the turnaround time for each order is collected, it is arranged in ascending order and then the 95th percentile is calculated. The TAT at the 95th percentile is a reflection of how many days it takes for 95 percent of the orders to be fulfilled. The decision to use the 95th percentile, or a percentile higher or lower, depends on the business needs. Many organizations refer to the percentiles as “fill rate.”
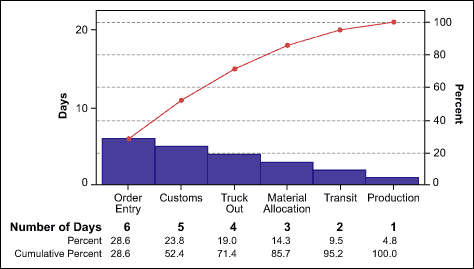
At the IT company, a Pareto chart (Figure 2) helped the project team understand which stage of the order fulfillment process was consuming the most time – order entry. The chart also allowed the team to see the need to break down the project into four Green Belt projects, and set priorities.
The four Green Belt projects were:
- Reduce the order entry TAT to less than two days, from the current six days.
- Reduce the customs TAT to less than three days, from the current five days.
- Reduce the truck out TAT to less than two days, from the current four days.
- Reduce the material allocation TAT to less than one day, from the current three days.
The over-all Black Belt project therefore became to reduce the order cycle time to less than 12 days for 95 percent of all orders. That is down from the current performance of 21 days. This case study only follows through the first Green Belt project – reduce the order entry TAT to less than two days. However, the other three Green Belt projects used a similar methodology.
The First Green Belt Project
Problem Statement: Data of the past three months showed that 95 percent of the purchase orders received from customers took six days or less to be processed and passed on to production. The goal was to have 95 percent of the purchase orders be processed and completed in two days or less within the next two months.
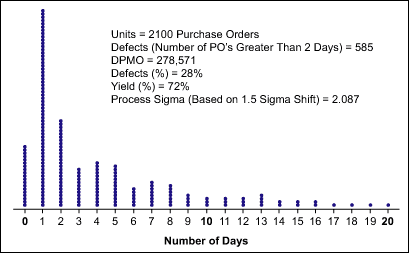
When performing the initial baseline capabilities, it is important to know what data statistics to pursue and what to ignore. Being too rigorous in trying to convert data to Six Sigma metrics like defects per million opportunities (DPMO), capability, rolled throughput yield, etc., may lead to loss of focus. Too much time can be spent trying to make the business understand the significance of each metric. Business managers are more interested in the visual representation of the data dispersion than on what the individual Six Sigma metrics represent.
In the case study, a simple dot plot (Figure 3) was used. Exploring the sources of variation for all purchase orders that exceeded the two-day specification limit formed the basis of further evaluation. The importance of reducing variations could be explained to the business leaders.
The next step was to identify the reasons why purchase orders were taking more than two days to be processed. Process mapping and creating a cause-and-effect diagram was done by the team before collecting data on reasons for order delay. This was to ensure that the right data elements were gathered for study.
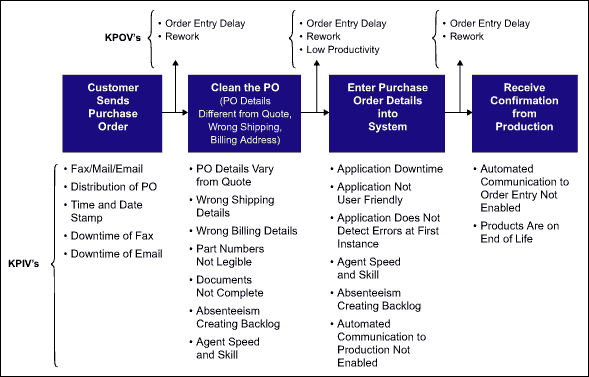
A process map was used to gather key process input variables (KPIV) and the key process output variables (KPOV). A Black Belt can add value by converting process flow maps into a format that makes it easier to derive the KPIVs and KPOVs (Figure 4).
Having derived the KPIVs, the team could create a cause-and-effect diagram. This exercise may not be required if the KPIVs are comprehensive enough.
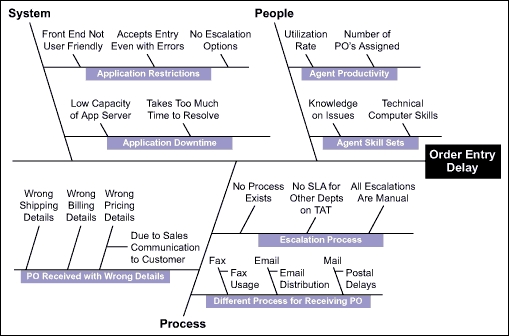
The cause-and-effect diagram (Figure 5) provided a list of root causes. However, the team still did not have a quantifiable prioritized list of KPIVs in terms of impact. This was achieved through the failure mode and effects analysis (FMEA).
A vital factor to note is devising the FMEA scale for the calculation of risk priority number (RPN). The scale should be customized according to the pattern of observed data. Trying to use a scale as established by quality manuals of, for example, the automotive or airline industries in this context will not only hamper the analysis but also will diminish value of a FMEA.
Data gathering in this case study was done by a simple time and motion study, wherein agents were monitored remotely to document the time spent on various activities of order entry.
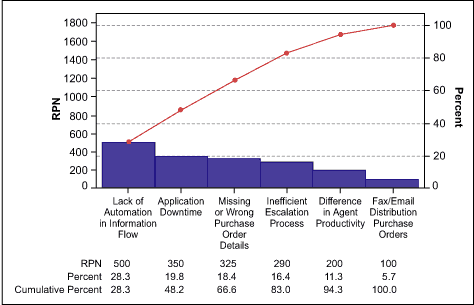
The Pareto chart above (Figure 6) is at a very high level. A similar Pareto chart can be drawn for subsequent levels of root causes under each of the above mentioned factors.
An implementation matrix (Figure 7) for all the factors identified aided in establishing timelines for deployment of solutions. The classification of the improvements will be short-term, medium-term and long-term.
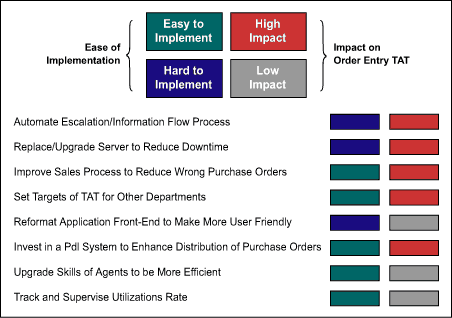
A combined list of all the “easy-to-implement” and “high-impact” improvements for the other three projects formed the basis of short-term improvement plans for the Black Belt project. These will be initiated and completed within two months. Improvement factors that fell under “easy to implement” and “low impact” are medium-term and will be completed within six months. Improvement factors that fell under “hard to implement” and “high impact” are long-term and will be completed within a year.
Conclusion: Success Starts Functional Level
The key to any Six Sigma order fulfillment project is in the scoping and successful breakdown of functions. Having a broad picture is certainly helpful but any deployment of solutions will happen at the level of individual functions. This truth makes it necessary to initiate the project at the functional level.