In the cable industry, faults (or defects) are often measured by technician visits to a customer’s home to address a problem experienced by that customer. Each such visit typically costs the company in the range of $120 to $150 – not counting the cost of the harm to their brand.
Cable Industry Basics
Especially problematic for cable companies are truck rolls – when a customer has a problem that is unable to be resolved over the phone and a technician has to be sent to the home – that occur after a recent new installation. It is not unreasonable to think that initial installation would be the least likely time for a problem to occur, but often this is not the case.
Cable Company X, located in the southern United States with nine markets in three different states, wished to track which installation variables were the most predictive of a truck roll within seven days of a new installation. (After seven days most customer issues are related to customer education, programming issues, etc. and not technical installation problems.) Company X’s defect rate was approximately 27 percent – that is, 27 percent of the new cable installs required a technician to return to the home within seven days to correct a problem. These are typically problems that should have been detected, and corrected immediately, while the technician was at the home for the installation.
The four parameters Company X tracks for each installation are:
- Downstream power: the power signal from the head end (the main cable office where the large receivers are located and from where all the wires originate) to the modem. This should be between -15 mV to +15 mV. (For better reception, a range of -9 to +9 is recommended for use.
- Upstream power: the power signal transmitted from the modem back to the head end. This should be between 37 dbmV and 55 dbmV.
- Downstream signal-to-noise ratio (SNR): reflects how clear the signal is from the head end to the modem. The ratio should be >30 dB – the higher the better.
- Upstream SNR: reflects how clear the signal is from the modem back to the head end. This should also be >30 dB – again, the higher the better.
Nearly all cable providers have their technicians capture these values upon installation in what is known colloquially as a “birth certificate”; these parameters can be monitored at the main office when a customer calls regarding a problem.
Reducing System Faults
Consider a sample of 110 new installations and a discrete response dependent variable, Y, of
- 0 = no truck roll within seven days
- 1 = truck roll within seven days
The four main parameters described above are the independent X variables.
To determine if there was a statistically significant correlation among the four parameters and the probability of a fault occurring within a week of a new installation, binary logistic regression was used. A subset of the data used is shown in Table 1.
| Table 1: Subset of Data for Four Parameters and Response | ||||
|
Downstream Power (-mV to +V) |
Upstream Power (dbmV) |
Downstream SNR (dB) |
Upstream SNR |
Response |
|
-0.12 |
40.57 |
43.22 |
32.01 |
0.00 |
|
-3.78 |
47.66 |
41.30 |
34.75 |
0.00 |
|
1.10 |
40.22 |
30.38 |
39.96 |
1.00 |
|
-3.19 |
44.95 |
50.05 |
47.46 |
0.00 |
|
-3.64 |
48.32 |
32.82 |
42.37 |
0.00 |
|
-0.24 |
46.00 |
36.22 |
32.08 |
0.00 |
|
-2.07 |
54.83 |
36.69 |
33.25 |
0.00 |
|
-1.65 |
49.14 |
40.60 |
50.00 |
0.00 |
|
1.04 |
42.25 |
42.51 |
40.15 |
0.00 |
|
4.96 |
50.47 |
34.86 |
35.97 |
0.00 |
|
1.62 |
49.82 |
38.68 |
38.02 |
0.00 |
|
8.96 |
42.58 |
40.31 |
35.77 |
1.00 |
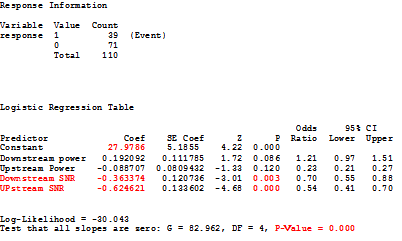
Binary logistic regression using the sample data provided the following result:

The logistic regression showed that only the downstream and upstream SNRs are statistically significant. The question that remained was: To what values should those variables be held to reduce the probability of having a truck roll within seven days?
The higher the SNRs are, the better; however, all of the ways to raise these values in the field have a cost: replacing wiring frayed from weather, replacing wiring frayed from animals (that eat through wiring), replacing or reducing splitters, ensuring connections are all tight, introducing additional amplifiers at key locations, etc. It was important to know what benefit could be achieved in order to compare that benefit to the effort involved in increasing the SNR and to decide how to tactically apply Company X’s resources.
The first step to improving the truck roll situation was to look at the logistics equation, using the output of the binary logistics regression:
Ln(p / (1 + p)) = 27.8 – (0.36 x downstream SNR) – (0.62 x upstream SNR)
Solving the above equation for p yields:
p = [e^ (27.8 – (0.36 x downstream SNR) – (0.62 x upstream SNR) ] / [1 – e^ (27.8 – (0.36 x downstream SNR) – (0.62 x upstream SNR)]
Let’s look at this information in table form. (Note: the natural logarithm e can be rounded to 2.718.)
| Table 2: Determining Probability of Truck Roll | ||
|
Downstream SNR (dB) |
Upstream SNR (dB) |
Probability of Truck Roll (%) |
|
30 |
30 |
25.30 |
|
31 |
31 |
8.20 |
|
32 |
32 |
2.93 |
|
33 |
33 |
1.08 |
|
34 |
34 |
0.40 |
|
35 |
35 |
0.15 |
|
36 |
36 |
0.06 |
|
37 |
37 |
0.02 |
|
38 |
38 |
0.01 |
|
39 |
39 |
0.00 |
|
40 |
40 |
0.00 |
The actual sample data set had a defect/truck roll rate of 35.5 percent (which is reasonably consistent with the defect rate of 27 percent for the total population). This model predicts 25.3 percent at the low end of the SNR range. Raising the SNR by only 10 percent – from 30 decibels to 33 decibels for both downstream and upstream – can reduce the probability of a truck roll within seven days to 1.08 percent.
Comparing this option to the cost of upgrading the grid, or plant, to raise the SNR at key points in the network allowed the business to make an informed cost/benefit decision.
Within Company X’s six major markets, the two smallest markets were selected for this implementation. Several nodes on the plant were also upgraded and the overall annualized savings added up to $526,000, net of the cost of improvements. Making changes in the two largest markets (one with 650,000 people and the other with nearly one million individuals) were cost prohibitive due to size and age of the plant. The mid-range markets intend to do a gradual update to their grids to raise the SNR, at which time annualized savings will jump significantly.