Today’s competitive world has made every organization rethink its strategy for long-term survival. It is becoming quintessential to realize the importance of human potential in the long-term success of any organization. A satisfied employee can actually be the differentiating factor in the struggle to gain market share, to deliver customer delight, to innovate product and services and, ultimately, to deliver a better bottom line.
Avant-garde organizations are using several tools to assess the satisfaction level of employees. The rigor of Six Sigma was used in one such project to assess and implement focused solutions.
Employee satisfaction in the organization was judged annually on the basis of the Q12 questionnaire used by Gallup Worldwide. An analysis by consultants only highlighted the few questions where the satisfaction percentage was lower than the benchmark. Management wanted a more detailed analysis to determine why employees rated low on those questions.
More About Employee Satisfaction
A focus group of employees randomly chosen at random was conducted to explore their views and their interpretation of the Q12 questions, and, of course, to find out the reasons for the low rating on the Q12 questionnaire. On the basis of the voice of the employee collected frpm the focus group, an internal dipstick was created with 30 questions that were grouped on three parameters – job related, self related and manager related.
A five-point scale, ranging from “strong agreement” to “strong disagreement,” was used in collecting the responses. Since all questions were written in a positive manner, anything below and including partial agreement was considered a defect for the purpose of analysis. Percentage of defects to total responses were taken as a score for each question.
Factor Analysis and Interaction Analysis
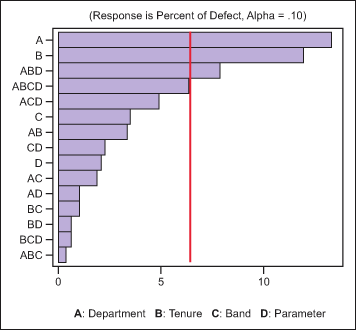
Factor analysis was carried out using four factors, with two levels each (Table 1). The anslysis looked at the two largest departments in the company. Those departments accounted for more than 70 percent of the total number of employees.
| Table 1: Four Factors, Two Levels | ||
| Factor |
Level 1 |
Level 2 |
| Department |
A |
B |
| Tenure |
< 1 year |
> 1 year |
| Band |
F |
B |
|
Parameter |
Job |
Manager |
| Table 2: Effects | ||
|
Term |
Effect |
Coef. |
| Constant |
54.388 |
|
| Department |
-13.325 |
-6.662 |
| Tenure |
-11.925 |
-5.962 |
| Band |
3.45 |
1.725 |
| Parameter |
2.125 |
1.063 |
| Department*Tenure |
3.375 |
1.688 |
| Department*Band |
1.9 |
0.95 |
| Department*Parameter |
-1.025 |
-0.513 |
| Tenure*Band |
1 |
0.5 |
| Tenure*Parameter |
-0.625 |
-0.313 |
| Band*Parameter |
-2.3 |
-1.15 |
| Department*Tenure*Band |
0.35 |
0.175 |
| Department*TenureParameter |
-7.875 |
-3.938 |
| Department*Band*Parameter |
4.9 |
2.45 |
| Tenure*Band*Parameter |
-0.6 |
-0.3 |
| Department*Tenure*Band*Parameter |
-6.4 |
-3.2 |

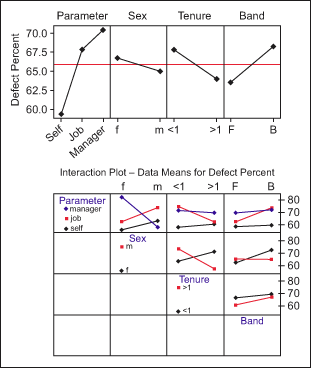
People in Department A with less than one year of tenure in the executive band were found to be relatively more dissatisfied with respect to their jobs. Subsequent interaction analysis was carried out on responses from Department A, on four factors and different levels, as shown in Table 3.
| Table 3: Department A | ||||
| Parameters |
Level 3 |
Job |
Self |
Manager |
| Sex |
Level 2 |
Female |
Male |
|
| Band |
Level 2 |
F |
B |
|
| Tenure |
Level 2 |
< 1 year |
> 1 year |
|

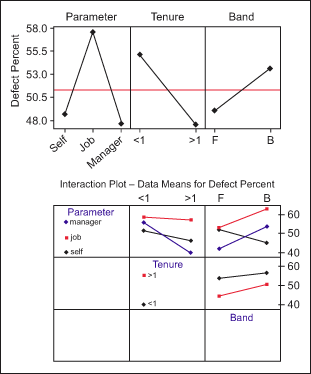
To gain more insight, a similar interaction plot was created for Department B, using the factors in the table below.
| Table 4: Department B | ||||
| Parameters |
Level 3 |
Job |
Self |
Manager |
| Band |
Level 2 |
F |
B |
|
|
Tenure |
Level 2 |
< 1 year |
> 1 year |
|

For each department, interaction analysis by function was carried out. Several solutions and several indicators emerged through this exercise.
Implementing Improvement Initiatives
Several improvement initiatives were implemented, ranging from a few cross-functional movements of managers, counseling sessions with heads of departments, initiation of self-development and learning programs, a few cultural initiatives for managing work-life balance, and structured feedback and a review program for every function.
Management saw an increase in interaction among employees, more involvement of employees in providing ideas for solving day-to-day problems, the initiation by employees of several projects to enhance process capabilities, and several other work-culture changes.
Plans are to use the response of employees on the internal dipstick along with other factors to build an attrition prediction model.
Thus, the rigor of Six Sigma can be of great value in areas such as human resources, which otherwise are perceived to be lacking in strategy and objectivity.