
Most public companies have gone through a period of frenzy ever since the enactment of the Sarbanes-Oxley Act (SOX) in 2002. Corporate leaders, faced with growing regulatory scrutiny and severe penalties, demanded that financial departments and outside auditors “get something in place, now!” People have been scrambling ever since to make sure their companies are compliant, without taking a step back to reassess how best to accomplish it.
Compliance at What Cost?
Just what does “compliance” mean? SOX, as well as most regulatory legislation, does not specifically spell out what kinds of controls companies need to have.
Given the business pressures and only vague direction from legislation, it is no wonder that compliance systems and processes, including SOX, are rife with inefficiencies. Here are a few questions that may signal that a company is “too compliant”: Are there requirements for multiple approvals at every level? More measurements and metrics than anyone can reasonably look at (and whose purpose is unclear)? Report after report produced that no one has time to read? Are there heaps of documentation (standard operating procedures, controls, graphs, sign-offs) on processes just to increase the odds of satisfying all of the (ill-defined) requirements?
In short, can a company state with confidence that its financial controllership systems operate effectively and efficiently? For most companies, the answer is no. Inefficiency is typical of compliance and regulatory systems.
Using basic Lean Six Sigma techniques, companies can refine their processes to improve their ability to demonstrate compliance and reduce time and resource costs along the way. But the first step is to understand, identify and prioritize risks. Here are a few tips based on tools used in compliance systems to help get started.
Tip 1: Evaluate and Understand Gaps
Since companies do not have endless resources, resources need to be applied according to the biggest benefit, or in case of compliance processes, the largest risk. In order to prioritize where additional Lean Six Sigma process efforts are necessary, the company should gain an understanding of where the biggest risks and gaps exist.
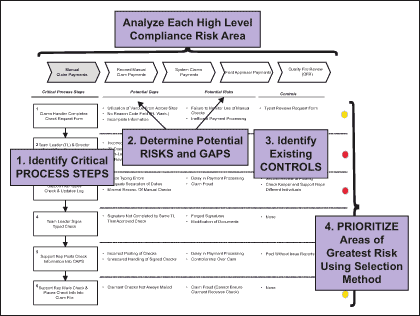
Figure 1 shows a high-level process diagram with potential risks and control gaps for a claims payment process at an insurance company. The team in this case started by charting the five high-level phases of the process (shown across the top), and then they identified risks, gaps and existing controls for each high-level process step (as shown in callouts on the diagram).
Using this analysis method, the company prioritized the processes with inadequate controls and that posed significant compliance risks. Then, they launched several phases of Lean Six Sigma projects, beginning with the highest risk gaps, to streamline the processes with the right controls.
Tip 2: Apply Basic Process Map Analysis
Another tool to increase understanding of key compliance risks is process map analysis, one of the foundational tools of Lean Six Sigma. Process maps in all their various forms – including value stream mapping, swim lane, deployment, etc. – can help companies determine what parts of which process are necessary to accomplish their purpose, and which add cost and time but no value.
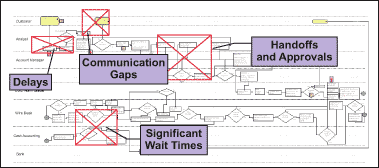
Figure 2, for example, shows a schematic of a process looking at how to most efficiently handle cash funding to clients, which is subject to certain approval and controllership regulatory requirements. The team created the map and then looked for “overprocessing” (non-value-added processes, or in Lean terms, waste), including unnecessary handoffs and approvals, communication gaps, delays or wait time, and rework.
Another process analysis approach is to measure and analyze how time is spent in a process, focusing on the time spent on value-added (VA) versus non-value-added (NVA) activities. Figure 3 shows a picture of another analysis method used by the team (actual data has not been provided). The method correlates process steps with a table that summarizes the time for each step, separating VA from NVA time.
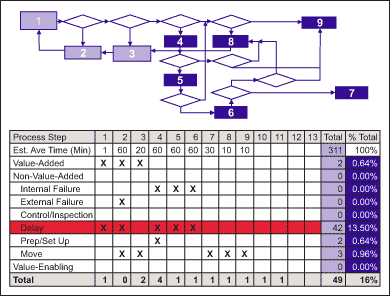
Taking the initial analysis from these tools, the team then continued with the detailed data collection and root cause analysis. The final process improvement efforts resulted in a decrease of late funding to customers from 41 percent to less than 5 percent and an increase in cycle time requirements from a sigma quality level from 1.2 to 3.2.
Tip 3: Use Data Tools to Identify Risks
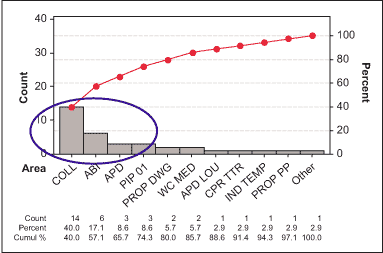
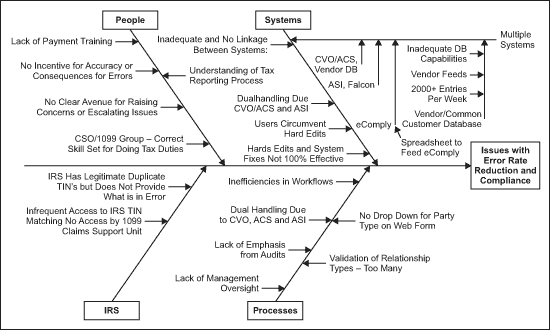
Two additional basic Lean Six Sigma tools that can be used to focus in on the highest areas of compliance risks are the Pareto chart and cause-and-effect diagram. Figures 4 and 5 are examples from a project that revolved around the required reporting of key vendor identification information to a federal government agency in order to avoid large penalty fines.
The Pareto chart in Figure 4 helped the company prioritize where (in which business units) the most exceptions or control failures were occurring. This was then helpful in prioritizing where process improvement efforts should be focused. In this case, the company quickly identified three focus areas for further analysis.
A cause-and-effect diagram (Figure 5) was also used to brainstorm potential factors or reasons for noncompliance or control failures. These then identified data that needed to be collected to validate the factors creating the greatest control gaps.
Tip 4: Use QFD to Select Appropriate Controls
Many Lean Six Sigma practitioners are familiar with quality function deployment (QFD) as a product development tool used to convert customer needs into specific product design features. Even a simple QFD, however, can help in selecting appropriate controls and process features to accomplish business objectives, whether for legal or regulatory requirements or for business requirements. A QFD can be used to evaluate the importance of existing controls and to select effective new controls against business objectives.
Figure 6 shows how QFD thinking was used in the risk management function of a financial services firm. They used the tool to develop better ways to evaluate the credit-worthiness of potential customers by listing the business requirements down the left side of the page with existing and proposed metrics across the top of the page.
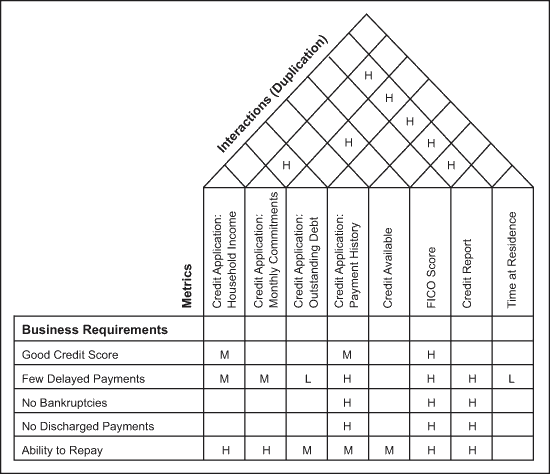
Each metric was then rated as High, Medium or Low in its validity for satisfying the business requirements listed down the side. Quickly, some metrics were determined to be of limited value and were thus removed from the credit assessment process as non-value-added. Examples of non-value-added data include net worth figures, which were often unreliable and not actually used in the credit decision despite being required of customers on application documents.
Then the top of the QFD was completed to determine if metrics were similar or redundant. Decisions were made regarding which metrics to retain as being more appropriate indicators of credit performance, and the metrics that were less appropriate or redundant were eliminated. An example of redundancy was the data collected on application forms related to all outstanding credit instruments when the pertinent data was already available on electronic credit reports. The result of the exercise was a leaner credit evaluation process that was easier, faster and less expensive to perform and less burdensome to customers completing application paperwork. Cycle times to customers were shorter as well.
Conclusion
The very real threat of facing substantial fines (and possible jail time, in conjunction with SOX) if companies fail to comply with various regulatory legislation seems to have thrown them into a state of panic. Rather than evaluate any actual risks or make sure processes are efficient and effective, they have relied on redundancy and layers of non-value-added work in hopes that they have their bases covered. News coverage over the past few years has documented the millions of dollars that companies have spent on their SOX systems – and given the inefficiency seen in many companies, the question should be asked: What value have they gotten for that investment?
The good news is that compliance systems are no different than any other business processes: They are made up of process steps and standards and people executing them. They can be evaluated and improved with Lean Six Sigma, just like any other process. In doing so, companies can increase confidence in their compliance systems and slash unnecessary costs.