
This article illustrates the Six Sigma DMAIC (Define, Measure, Analyze, Improve, Control) process using an organization that develops software packages as an example. The Six Sigma DMAIC approach to process improvement provides a powerful mechanism for improving the software process. Typical benefits will exceed costs within 6 to 12 months from initiation of a Six Sigma program for software development, and the on-going return will be very substantial – often a 15-25 percent reduction in software development costs in year two, with continuing reductions thereafter.
Project Selection
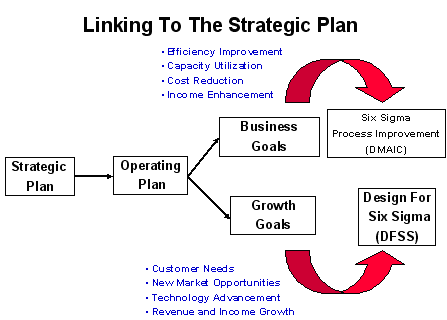
While the selection process precedes a project’s Define phase, identifying an initial general goal, there is a chicken and egg relationship with Define as that goal is better understood and refined. We have an initial idea of our goal, but we may need to do some of the Define work before we know if the scope is reasonable. Project selection brings out another important consideration not directly addressed by Define – it establishes the link between candidate projects and corporate strategy (in one sense, these are the top level Ys).
The Define Phase
The first phase of a Six Sigma process improvement project, known as “Define,” has four steps:
- Identify the customer and the critical to quality (CTQ) requirement that will be the focus of the project. The CTQ may also be referred to as the project Y [as in Y = f (x)].
- Create the project charter.
- Develop a high-level process map.
- Define phase tollgate review.
As a general rule, the scope of a Six Sigma DMAIC project is limited so that the project can be completed within four to six months – this guideline avoids projects that try to “boil the ocean.” Experience clearly establishes that overly large projects have a high failure rate. Hence, it is often necessary to decompose the initial project objective into a series of lower level objectives that become individual projects. This may be referred to as decomposing the project Y.
The following diagram illustrates one way we might decomposed a “big” Y into a series of smaller, more manageable objectives that contribute to realization of the larger goal – in this instance, improving software related “capability” (to deliver projects on time, with predictable effort, and with an acceptable number of released defects). This decomposition raises the issue of project prioritization and selection – we have limited resources that can be devoted to improvements, so which shall we do first?
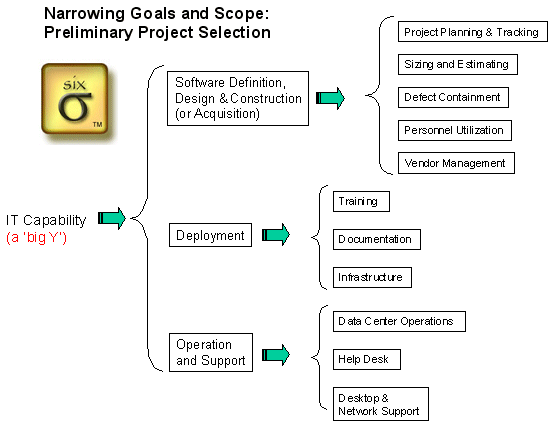
Let us suppose that you are in an organization the produces software packages for sale. If this is where you live you probably are most concerned with the software definition, design and construction path. If that is the case, the second level Ys might include time to market, total development cost per size and delivered quality in terms of defects. We recognize that there are potentially many factors that influence these outcomes, so we need to decompose further to get to a Six Sigma project of manageable scope.
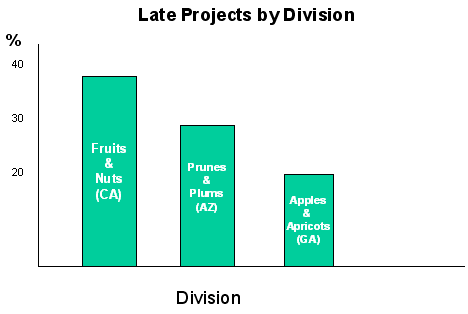
Let us then suppose that recent experience has led you to believe that your ability to meet schedules is poor – which in turn suggests a third level Y. At the third level the CTQ objective might be something like the percent of project commitments delivered on time (or perhaps within some plus or minus window). Now we’re focused on something likely to be actionable in a reasonable time, and we have an initial idea how to measure success. As we investigate further we may decide to decompose to a fourth level (or more), so let’s take this decomposition process one more step. Let’s assume we are a decentralized organization with various divisions in different parts of the country – in that case we may elect to further narrow the scope of our project to a particular division. Typically we will look at data we have, such as the percentage of late projects for each division, as a way to select the division to tackle first. Assuming we are successful with the first division we can replicate the process to other divisions later.
Once through this first step in the thought process we move to step 2 – creating the project charter. A charter will typically include:
- A business case: What is the expected payoff if you are able to improve the CTQ? Preferably this to be expressed in dollars whenever possible – some organizations are totally insistent on this point, some accept soft benefits.
- A problem statement: A succinct statement of the business problem that you are attempting to solve. Using the software company scenario above this might be something like “missed schedules are impacting customer satisfaction and are causing us to miss our revenue targets.” An organization concerned with deployment of purchased packages might describe the problem as “conversions that miss planned dates are causing unexpected budget increases that impact our profitability.”
- Goal statement: Here we want to state the objective in terms of the metric associated with the project Y. This could be stated as “improve the on-time project percentage from the baseline value of 62 percent to 90 percent within the next year.” (Notice this goal could be equally appropriate for an organization that buys and deploys software packages.)
- Project team: For example, the project leader would likely be a Green Belt. The project sponsor (Champion) is the VP of marketing, and team members will include the director of the project office, three software project managers and the director of quality assurance.
- Scope: For example, the project will concern itself with standard product development and deployment projects only, not custom software developed under contract.
- Financial opportunity: “Marketing surveys indicate that up to 10 percent of potential service contract revenue is lost due to late software deliveries. Subject to validation, the opportunity in our most recent fiscal year amounts to at least $800,000 per year.”
The Measure Phase
The Measure phase can be viewed as consisting of eight steps:
- Confirm/refine the project Y (CTQ): We will investigate more fully how this will be measured, evaluate the validity of available measures and confirm our initial hypothesis as to the magnitude of the problem/opportunity.
- Define performance goals or standards: Here we establish our target for improvement in the Y, setting a goal that is aggressive but attainable.
- Identify segmentation factors for data collection plan: Here we identify factors that naturally segment our project Y (by project, product, organization, etc.) and Xs that are likely to influence the Y, and define how, when and where we will measure them. Generally speaking, factors that influence outcomes are of two types – things we can control and other factors (noise) that we can’t control. We are trying to understand what’s going on.
- Assess and calibrate the measurement systems to be used: Are they reliable and consistent? How accurate are the data?
- Data collection: We gather the needed data.
- Describe and display variation in current performance: What are the distributions/ranges of X and Y values currently?
- Containment plan: If the current process is in critical condition, what quick fixes could be put in place to reduce the bleeding until we devise a permanent fix?
- Measure phase tollgate review.
Let’s work through each of these steps, continuing our focus on improving our project planning process.
Confirm the Project Y
We indicated in the Define phase that our goal for the Y was to improve our on-time project performance from the current baseline of 62 percent to 90 percent during the next year. To confirm or refine this Y we will need to probe a little more deeply into where this data came from, and what definitions it was based on. For example, what is the definition of “completion”? Does that mean the date the customer accepted the system? Or does it mean the date that the software team declared it was “finished”? There is often a big difference between these dates – the one that really counts is the customer’s date.
Define Performance Goals or Standards
After we collect some data that will allow us to confirm that the initial estimate of the on time rate (62 percent) is correct. We will re-examine the feasibility of our goal. Our initial targets calls for an improvement of about 50 percent, which seems reasonable as a stretch target for a Six Sigma project.
Identify Segmentation Factors for the Data Collection Plan
A review of professional project planning practices reveals certain attributes of effective planning processes. These attributes give some clues how we may wish to segment (or characterize) our projects for analysis. We might, for example, decide to investigate four controllable factors that appear to be associated with effective planning (recognizing that there may be other factors we haven’t yet identified):
- Short task durations
- Defined predecessor/successor relationships among tasks
- “Leveled” resources (making sure we had not planned 80 hour weeks for the team)
- Defined deliverables or end states for each task
There are also likely to be certain noise factors that we do not control – things that are simply aspects of the environment. Depending on the size of our organization and the number of projects we have completed in the last year or two, we may be able to segment or stratify the data in ways that will give additional insight into what is going on. We may, for instance, segregate the data according to the development or deployment group that did the work, or we may stratify according to the type of software project (e.g., business applications versus firmware that is embedded in a hardware component). It will often be the case that such segments will have different success rates.
Evaluate (Analyze) the Measurement System to be Used
In this instance our “measurement system” is probably largely our project management software system – something like Microsoft Project, for example. So, we will want to see if we can locate the plans that were developed and used for the recent set of projects that were used to determine the baseline performance of the Y. Assuming we find them (not always the case) we will want to interview the people responsible for updating and using these plans.
Do the plans reflect the work that was actually done? Were tasks added or deleted as the project progressed? Was the baseline plan saved so that we can accurately determine the promised completion date for comparison to the actual? How were project requirements changes handled? If the customer added significant new requirements during the project, was the baseline (target) date appropriately adjusted to reflect the change in scope? What rationale was used to make such adjustments? Does the customer agree that adjustments were reasonable?
The answers to questions such as these may lead us to make various adjustments to the data to make it more consistent and valid before we begin to analyze it. Sometimes we must face the fact that the data is so bad it is not usable without serious risk of drawing the wrong conclusions. The Six Sigma message is simply “understand the quality of the data before drawing any conclusions.”
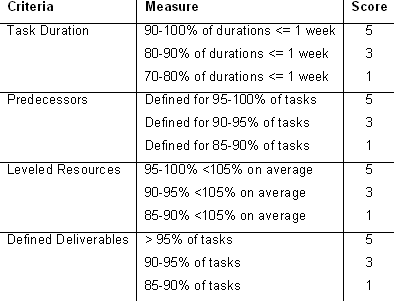
An additional issue we deal with here is how to convert attribute information into something quantitative. There are a great many ways that might be done – here we offer one approach suitable to this situation. The attributes mentioned above are potential Xs that influence the schedule performance outcome – we believe that if we do a good job satisfying these attributes we will be more likely to deliver the project on time. Our hypothesis then is that high ratings on the Xs will be positively correlated with higher Y ratings.
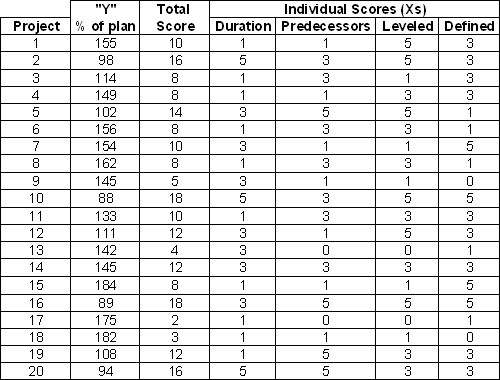
One way we might approach determining if this hypothesis is correct would be to set up a scoring scheme by which we rate the Xs for each of our historical projects in order to see if higher attribute scores are indeed correlated with better schedule performance. Here is one example of how we might do that (many other reasonable approaches are possible):
Data Collection
Using this scoring scheme, our next step is to collect the X and Y data for each of the projects in our baseline sample. That might produce a set of data something like that shown below.
Describe and Display Variation in Current Performance
Once we have this data we will want to display it graphically in order to see what, if any, relationship there may appear to be between our Y (schedule performance, defined as percent of plan, and our summary X, total score). We might produce similar graphs of the individual elements of the score.
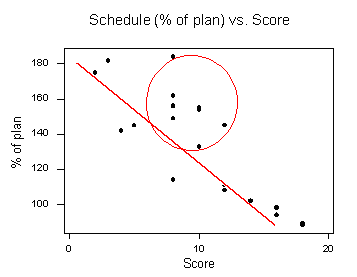
This would gives us a result like the adjoining graph which shows us at a glance that there does appear to be a relationship between our X and Y, as suggested by the trend line – as the score increases (more of the attributes of a professional plan are present) we see that the our Y (percent of plan) improves – projects with professional plans seem more likely to be on time. But we also notice that there are some projects (those inside the circle) that don’t seem to fit the general pattern – these suggest that some other factor we have not yet considered may be impacting the outcome. We don’t have enough evidence yet to be sure there is a cause and effect relationship, but clearly the connection merits a closer look – that’s what we will do in the Analyze phase.
The Analyze Phase
Analyze is a seven step process:
- Measure the capability of the existing process
- Refine improvement goals
- Identify significant data segments/patterns
- Identify possible Xs
- Identify and verify critical Xs
- Refine the financial benefit forecast
- Analyze phase tollgate review
Determine/Refine Measurement of Process Capability of the Existing Process
When we examine the data we have collected during the Measure phase we see that it reveals that using the customer’s dates we have a 20 percent on-time rate (our baseline), not the 62 percent figure we got from the software team. We can convert this information into one of the several available standard Six Sigma measures of capability (defects per million opportunities [DPMO]; z-score; sigma level; Cp; or Cpk).
We won’t go into the mathematics of these here (you can find more on this elsewhere on this site). In this instance we would probably choose Cpk (worst-case capability) as the most suitable choice, and we would find that the value we get is less than .2 – not very good! We would like to see a value of at least 1, and higher would be better.
Refine Improvement Goals
With this knowledge in mind, we may want to re-evaluate our goal. If the goal is to remain 90 percent that means we are targeting an improvement of 450 percent! While this may not be impossible, a single intervention is unlikely to produce a gain of that magnitude so we may wish to set a target that is more realistic and attainable in the near term, within the scope of our current project. When the gap is this large it is likely we will need a series of Six Sigma projects to close it – usually a better choice than one very large project. We may choose to keep 90 percent as our stretch target, but we should not be disappointed if our achievement on the first project is somewhat less – the payoff may still be very substantial.
Identify Significant Data Segments/Patterns
As indicated earlier, we could segment the data by software group or by software type – if we did so we would follow the pattern of analysis discussed here for each segment independently. In the interest of keeping this easier to follow we will focus on the single segment of data shown earlier – as already mentioned, we do notice a pattern in this data. Most of the project outcomes seem to be related to the planning best practices attributes reflected in the data we collected, but there are five ‘outliers’ that seem to be influenced by one or more other factors.
Identify possible Xs
Our observations about the pattern in the data lead us to the next step in our analysis. What other unidentified factors might explain the outliers we have observed? One of the factors influencing software project outcomes is the schedule itself – when we start with an unrealistic schedule, bad things often happen.
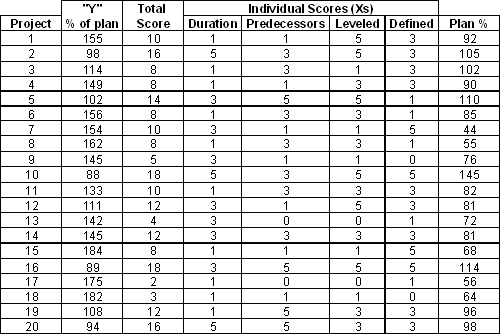
This gives us a clue that the realism of the planned schedule could be one of the factors that explains the outliers we observed. We can investigate that hypothesis by collecting an additional piece of information about each of these projects (i.e., how did the planned schedule compare to industry norms for similar projects)? One way we might answer this question would be to use one of the commercially available software project estimating models. Note that there are a number of complicating factors relating to use of these models that we won’t go into here – that topic will be addressed in a future article. For now, we ask that you accept our assertion that this can be done.
We gather this additional piece of information about each of the 20 projects and add it to our data table – we’ll call the new column “plan percentage” which we define as (actual planned duration)/(duration indicated by the estimating model). This means that when we have a value less than 100 percent our planned schedule was shorter than that given by the model – in other words, unduly optimistic. This results in a new table that looks like this:
Although we now have what seems to be a good candidate list of controllable factors, we may want to probe a bit deeper to see if we can discover the underlying whys. Why did we not break large tasks down into one-week segments? Why did we not define predecessor/successor relationships among our tasks? One of the Six Sigma tools, known as the 5 Whys, encourages us to probe deeply by asking why five times in an effort to get to the real root of the problem. To illustrate:
Why don’t we define predecessors?
– we didn’t know it was important
– why? – no training was provided
– why? – no training budget
– why? – manager didn’t think it important
This analysis tells us something about issues we will need to address to make an improvement stick.
Identify Critical Xs
With this data in hand we can determine which of these factors are the most influential in determining the schedule performance outcomes. One way we can do that is to use multiple regression analysis. Again, we won’t go into the details of how to do that, we’ll just go direct to the conclusions we can draw from such an analysis.
The conclusions we reach from analysis of this sample indicate that about 78 percent of the variability we see is explained by three factors (the Xs) – task duration, predecessors and plan percent. Hence our project (likely this is really two objects – one to deal with the planning process and one to deal with the estimating problem) will focus on actions we can take to improve our control over these Xs.
Refine the Financial Benefit Forecast
In order to determine what improvements like this would be worth to the business we might go back to the business cases for our sample project to make an estimate of the opportunity cost to the business resulting from the delays. To illustrate, we might find that the average first year business benefit expected from these 20 projects was $850,000. We know from our data that on average our projects are planned to take 15 months, and that on average we actually require 134 percent of the planned duration – hence on average we are five months late.
Given the average delay and the average first year business benefit we may estimate the opportunity cost as 5/12 times $850,000 ($354,000) times cost of money – at 15 percent the is about $55,000 per project, or over $1,000,000 total for our 20 projects if they could all be delivered on time. Our target is 90 percent on time, so we might reasonably expect a benefit of around $900,000 if that target is achieved.
As suggested above, it appears that we will really need two different projects to accomplish our goal, so we might say that our expected annual benefit for each project is actually $450,000, less whatever it may cost us to do the project. Experience indicates that we can do projects like this for far less that the expected benefit – $100,000 or less per project might be a typical cost.
The Improve Phase
We will continue our example on the assumption that we have decided to spin off the effort to improve our estimating as a separate Six Sigma project – we will follow that thread in a future article. Here we will focus only on the professional planning practices.
Improve is a 5-step process:
- Identify solution alternatives
- Tune/optimize variable relationships between Xs and Ys
- Select/refine the solution
- Pilot or implement the solution
- Improve phase tollgate review
Identify Solution Alternatives
There appear to be three obvious options in the case – we could 1) train all of the people responsible for project planning on best practices, 2) assign mentors or coaches from the project office to review the draft plans and help project managers bring them up to the best practice standard or 3) use some combination of these options.
Tune/Optimize Variable Relationships Between Xs and Ys
In this instance no tuning is necessary – we see that there is a clear relationship between higher X ratings and better Ys.
Select/Refine the Solution
Here we will evaluate each of the solution alternatives with respect to applicable effectiveness criteria. In this instance we will consider the cost of each option, how effective we believe it will be, and perhaps the lead-time required to implement. Most likely we won’t have any real data about relative effectiveness, so we likely want to pilot two or more of the options to evaluate relative effectiveness. That leads us to the pilot step – after we have the results of the pilot we will make a final selection.
Pilot Test or Implement the Solution
We may decide to try each of the alternatives with a different team, and do a review at the end of two or three months to see how each of the pilots is working out. To do this we might, for example, score the plans these teams have produced using the same approach applied to our historical data. If one method shows a meaningful (positive) difference we most likely select that option if it is reasonably in line with the second best option with respect to cost and lead-time.
The Control Phase
The purpose of the Control phase is to make sure that our improvements are sustained and reinforced. We want to be sure we put in place all of the actions that will help the change be both successful and lasting.
Control can be described as a 5-step process:
- Develop control plan
- Determine improved process capability
- Implement process control
- Close the project
- Control phase tollgate review
Develop Control Plan
The control plan will define how we will monitor the Xs and the Y, and what actions we will take if these metrics indicate we have strayed from our planned levels. We will also specify what action is to be taken if the metrics are off target.
In this instance we may decide that each project plan will be scored at the beginning of each project phase, and any that scored below a five on any of the Xs will be required to make changes to bring the plan up to that level. We might also indicate that we will require a special project review if the target for the Y is not met. The goal of such reviews will be to discover why the goal was not met, and to institute corrective actions as necessary.
Determine Improved Process Capability
Here we document the new level of performance of the selected success metric.
Implement Process Control
We have defined what we will monitor, who will do it and how often. In this step we simply execute our control plan.
Close the Project
Closing the project includes a formal transfer of responsibility from the Six Sigma team to the operational personnel who will sustain the process. As part of the closing process the team will archive all of the project records and data, and will publicize lessons learned and successes.
Six Sigma Process Improvement – Engaging the Team
Improving a process, like building character, can be done by the people involved, but not to them. Hence in Six Sigma we engage and empower the people who perform the software processes to plan and implement improvements themselves, with the guidance and assistance of Six Sigma specialists who are fully versed in software development best practices (both sets of knowledge are critical to success).
This requires a fundamental change in the way most software people view their jobs.

The Six Sigma DMAIC approach to process improvement provides a powerful mechanism for improving the software process. Typically benefits will exceed cost within 6 to 12 months from initiation of a Six Sigma program for software development, and the on-going return will be very substantial – often a 15-25 percent reduction in software development costs in year two, with continuing reductions thereafter.
In order to realize these gains it is essential to recognize that a significant cultural shift must occur. Achieving this cultural shift is best accomplished by providing Six Sigma training for all of the senior developers and managers in the software organization, with a mix of Champions and several levels of Six Sigma specialists (Yellow Belts, Green Belts and Black Belts) appropriate to the size of the organization.