To characterize the effectiveness of productions tests, practitioners often use several types of metrics. Some measure the efficiency of the manufacturing process, while others measure the productivity. While these metrics are useful in many situations, they also come with drawbacks and limitations. One process can be efficient but not productive, while another may have high productivity but may be very inefficient.
When undertaking a Six Sigma project to enhance the effectiveness of production tests, the choice of metrics used is critical for describing improvements made to the process. Therefore, practitioners must understand the strengths and weaknesses of various traditional metrics, and also may benefit from learning about an alternate method to quantify the effectiveness of the production process.
Creating an Ideal Test Plan
Typically, the earlier that problems in a process are detected and corrected, the less costly and more effective the process becomes. This applies to any industry, be it software or hardware, development or manufacturing. Testing strategy usually involves multiple phases, each building on the previous phase. Testing starts at the component level, then moves to the assembly level, then to a system level and finally up to the system integration level.
With that understanding, a production test flow that detects problems (or failures) in the early operations is more effective than a similar test flow that detects the same problems in the later stages. The goal of a test strategy is to implement a plan that:
- Detects problems
- Reduces rework
- Verifies functionality
If the quality of the testing strategy improves, the metrics relating to production test flow, such as the number of failures, should also improve.
Typical Production Metrics
Several metrics are often used in the testing process to describe and measure manufacturing flow. These metrics include first pass yield, throughput yield and cycle time.
First Pass Yield
First pass yield (FPY) is used to measure the level of rework. In the production flow, FPY is calculated for each operation (or step). Units that successfully complete a step on the first pass are compared to the total number of units coming into the step for the first time. Units that had previously been through that operation and are being rerun as a result of rework are ignored for this calculation.
Taken one step further, FPY for all operations can be averaged together to measure the entire production flow. This provides a sense of how effective the overall flow is performing. One variation of the average FPY is to weight the FPY for each of the steps by the number of first-pass units tested at each step. Weighted-average FPY is particularly helpful if the flow of units through the production test comes in batches.
Throughput Yield
Another way to view the production flow from beginning to end is the throughput yield. This is accomplished by multiplying the individual FPY values for all operations. For example, if the production flow is a series of five operations, then the overall FPY can be represented as:
FPY(flow) = FPY(op1) x FPY(op2)… x FPY(op5)
This overall FPY, also known as the rolled throughput yield, represents the probability of one unit moving through the entire production flow process without any failures.
Cycle Time
Cycle time is the measurement of elapsed time. Cycle time can be measured at the individual operational level or across the entire production process. For example, cycle time for the production flow might measure the time from system configuration (the assembly of components to create the system) to customer acceptance.
Two types of cycle time are typically generated. Static cycle time is the actual measurement of a single unit from start to finish. Dynamic cycle time is the overall average cycle time. While static cycle time can fluctuate depending on failures, parts availability, resource availability or even demand, dynamic cycle time is thought to reflect more accurately the steady state of production.
Metric Limitations
FPY is a good metric to use as a starting point for measuring a single operation in a production flow and its contribution to rework because it is not a failure-rate metric (failures during the second pass, third pass and so on would also be counted).
An average FPY also is helpful, but may be misleading. Adding or removing steps to the flow could have a significant impact, either positively or negatively, to the overall average. Second, it is simply an average. Say there is a five-step production flow that is averaging 80 percent FPY. How does a practitioner determine whether a five-step process at 80 percent FPY is better or worse than three steps at 100 percent or two at 50 percent?
Combining the FPY of multiple operations to generate rolled throughput yield may not be useful, especially considering the following two limitations:
- There is an inherent penalty for multiple steps. The more steps or operations involved, the lower the overall FPY or rolled throughput yield. If the yield at every operation is identical, more steps will result in a lower rolled throughput yield. For example, in a five-step test flow, if every step has an FPY of 95 percent, then the rolled throughput yield for the flow is 77.38 percent. However, if there are 10 steps in the flow and all have a 95 percent FPY, then the rolled throughput yield for the longer flow is 59.87 percent.
- A perfect yield (100 percent) in the test flow has no impact on the overall rolled throughput yield. Practitioners can add or eliminate an operation with 100 percent yield and the overall rolled throughput yield would not be affected. In fact, the only way to improve the rolled throughput yield for a flow is to improve the yields at the individual operations levels. But not all operations are equal. A 5 percent improvement at an early step has a greater impact on overall rolled throughput yield than a 5 percent increase at a later step. More operations in the production flow result in a greater impact. This favored treatment of early operations by rolled throughput yield can be problematic because it is more cost effective to catch and correct failures early in the flow.
Weighing Failure Data
Failure reporting can also have a bearing on the validity of metrics. Defining a failure is critical to a successful test strategy. The metrics should reflect accurately what is happening in the production test flow. If some minor failures are reported, but no action is taken until later and the unit continues through the flow, then the minor failure should not be used in calculating FPY. Similarly, if a component fails at the operation level, but the component is replaced and testing continues with no additional rework, then FPY is a failure metric and not a rework metric.
In these scenarios, there are different levels of failures, and the impact of each failure level on yields must be determined. In most cases, not all failures are handled in the same way. When that is the case, failures should be ranked according to different levels of severity. Often three or four levels of severity are sufficient, with the lowest level not impacting yields or throughput because those failures impact neither functionality nor performance and do not require rework. Only those failures that result in rework should be reflected when calculating FPY.
Test Flow Metrics: An Alternative View
In order to gain an overall view of the effectiveness of production tests, a broader understanding of improvements and metrics is necessary. What are the changes that would indicate improvement in production test flow? They include:
- Failures captured earlier in the test flow
- Increases in throughput
- Reduction in rework and work in progress
- Fewer test steps
- Improved level of automation of tests
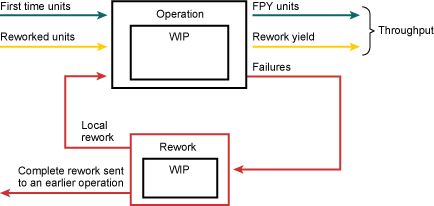
When reviewing a single operation in a production test flow, there will be work in progress (WIP) at any given point in time (Figure 1). These WIP systems have not completed the operation; they are units that are either in the process of being tested or waiting to be tested. This WIP can further be classified as units coming into the operation for the first time or units that have been through the operation before but are going through again due to having been reworked.

Upon completion of the operation, the unit under test has either passed or failed. If passed, the unit is counted as a first-pass unit, if this is the first time through the operation, or a rework yield. Throughput is the sum of all passing units. Any failed units will be reworked. After the rework is completed, the unit will either be returned to the current operation for retesting or sent to an earlier operation for retesting, depending on the severity of the rework.
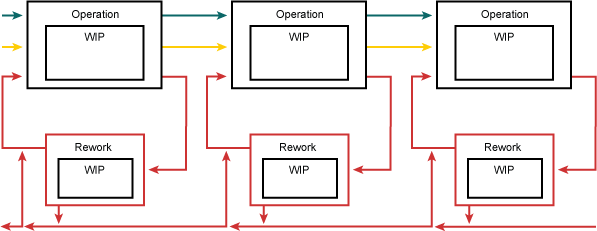
This flow of units into and out of an operation is repeated for every operation in the production flow (Figure 2). Efficiency at the operation level and at the production flow level should represent all aspects of the work flow, not simply the first time a unit passes through an operation.

A metric that shows the relationship between cycle time, throughput, work in progress, rework, number of operations and level of automation would provide an accurate indication of the health of the overall production test process. Rather than propose such a metric, resulting in potential micromanaging of the test process, there may be an easier way to take into account the complexities and relationship of the system and the process.
Only two metrics are important to make a company profitable: capacity and cost of goods sold. In order to track the efficiency and effectiveness of the production test flow, the cost of each unit should be monitored. The average unit cost of a system includes the cost of component parts and the typical or average assembly and test time required to get the system out the door. One suggested method is to track the actual cost for each system. If components have been replaced, add it to the cost for that system. If the system goes through several operations multiple times, practitioners should track the effort required to rework the system. The result will then allow an accurate evaluation of any improvements made to the production test flow.
Until practitioners know how much the failures cost in terms of materials and labor, there is no good way to measure the effectiveness of the production test flow. Once the actual cost for each system going through production is known, then any improvements made that increase yields and throughput or decrease work in progress, cycle time or rework will be reflected in the cost of the units produced.
Accurately Tracking Impact
Current production test environments typically focus on metrics such as FPY, rolled throughput yield and cycle time. While these metrics are useful, they give no indication of the overall effectiveness of the test flow. It is possible to make significant improvements to the production test flow but still not see the enhancements reflected in these metrics.
The effectiveness of production test flow is given by the actual cost of systems in the flow added to the throughput of the flow. Tracking the cost of replacement components and labor necessary to reassemble and test accurately reflects the impact of all other metrics on the overall system flow. By tracking the cost associated with rework – including all material and labor – when issues arise in production, practitioners will learn the impact of the issue and be better prepared to dig deeper to find the root cause.