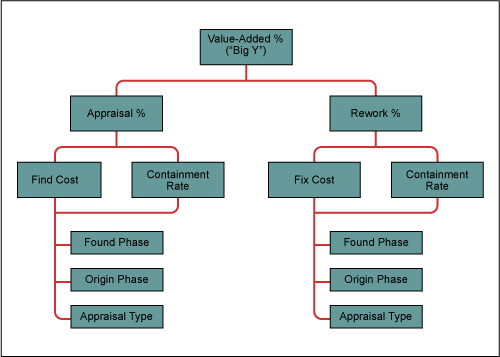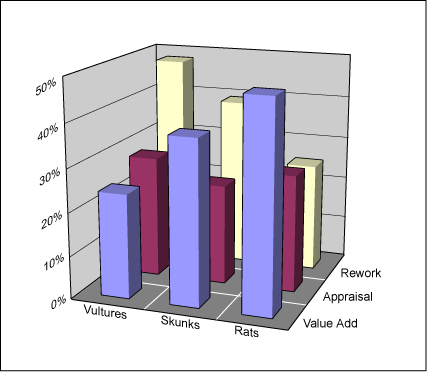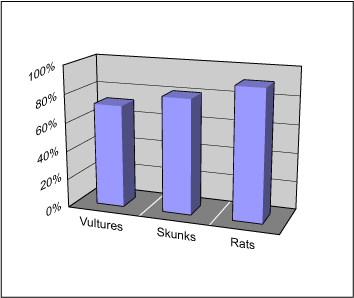
A case can be made for using cost-of-quality metrics, combined with defect data, as overall measures of software and IT organizational effectiveness (Figure 1). The next logical step is to illustrate how these metrics might be used to drive improvement.
The illustration can best be made with a “case study” of the famous-but-mythical software and IT outsourcing group, SpiffySoft. Spiffy management decided 18 months ago to differentiate from competition and gain competitive advantage by aggressive application of Six Sigma. To support that, the company initiated time accounting using the cost-of-quality framework, combined with defect tracking.

Spiffy now has 12 months of solid data for each of its three primary divisions, covering a total of 20 to 30 projects for each. Table 1 summarizes averages of the key effort-related metrics for each division, by lifecycle phase (including the first three months after delivery).
| Table 1: Effort-Related Data | |||
|
Division |
|||
|
Metric |
Vultures |
Skunks |
Rats |
| Requirements Total Effort |
4.4% |
11.1% |
15.3% |
| Value-Added Percent of Effort |
100% |
100% |
85% |
| Appraisal Percent of Effort |
0% |
0% |
10% |
| Rework Percent of Effort |
0% |
0% |
5% |
| Design Total Effort |
5.5% |
12.5% |
17.8% |
| Value-Added Percent of Effort |
100% |
100% |
88% |
| Appraisal Percent of Effort |
0% |
0% |
8% |
| Rework Percent of Effort |
0% |
0% |
4% |
| Build Total Effort |
15.4% |
15.3% |
25.4% |
| Value-Added Percent of Effort |
92% |
93% |
78% |
| Appraisal Percent of Effort |
5% |
4% |
14% |
| Rework Percent of Effort |
3% |
3% |
8% |
| Test Total Effort |
28.0% |
30.6% |
26.3% |
| Value-Added Percent of Effort |
– |
– |
– |
| Appraisal Percent of Effort |
72% |
73% |
78% |
| Rework Percent of Effort |
28% |
27% |
22% |
| Post-Release Total Effort (3 Months) |
46.7% |
30.6% |
15.3% |
| Value-Added Percent of Effort |
– |
– |
– |
| Appraisal Percent of Effort |
– |
– |
– |
| Rework Percent of Effort |
100% |
100% |
100% |
| Grand Total Effort |
100% |
100% |
100% |
| Value-Added Percent of Effort |
24% |
38% |
48% |
| Appraisal Percent of Effort |
28% |
23% |
27% |
| Rework Percent of Effort |
48% |
39% |
25% |
Table 2 summarizes defect-related data.
| Table 2: Defect-Related Data | |||
|
Division |
|||
|
Metric |
Vultures |
Skunks |
Rats |
| Requirements | |||
| Containment Effective (Percent) |
0% |
0% |
62% |
| “Find” Hours Per Defect |
– |
– |
.75 Hrs. |
| “Fix” (Rework) Hours Per Defect |
– |
– |
.25 Hrs. |
| Design | |||
| Containment Effective (Percent) |
0% |
0% |
48.7% |
| “Find” Hours Per Defect |
– |
– |
1.6 Hrs. |
| “Fix” (Rework) Hours Per Defect |
– |
– |
.6 Hrs. |
| Build | |||
| Containment Effective (Percent) |
8.4% |
10% |
52% |
| “Find” Hours Per Defect |
3.3 Hrs. |
3.2 Hrs. |
3 Hrs. |
| “Fix” (Rework) Hours Per Defect |
1.1 Hrs. |
1.2 Hrs. |
1.1 Hrs. |
| Test | |||
| Containment Effective (Percent) |
62.6% |
78% |
82.6% |
| “Find” Hours Per Defect |
20 Hrs. |
18.8 Hrs. |
19.2 Hrs. |
| “Fix” (Rework) Hours Per Defect |
6 Hrs. |
6.1 Hrs. |
5.8 Hrs. |
| Post-Release (3 Months) | |||
| Containment Effective (Percent) |
71.6% |
80.2% |
91% |
| “Find” Hours Per Defect |
– |
– |
– |
| “Fix” (Rework) Hours Per Defect |
42 Hrs. |
43.7 Hrs. |
38.4 Hrs. |
Summary Observations
Here are some observations based on the data in the tables:
- Effort required to find and fix defects in a given phase does not vary significantly across divisions.
- Effort to find and fix defects increases significantly in all divisions as they progress through the life cycle.
- Vultures devoted a significantly lower percentage of effort to early phases than did the others. They also devoted less effort to appraisals prior to the test phase, delivered the lowest quality (post-release containment effectiveness), had the lowest overall value-added percentage and highest rework percentage.
- Skunks devoted relatively more effort to requirements and design than did Vultures, but also relied primarily on testing to remove defects. Their results in terms of delivered quality and total value-added were better than Vultures, but significantly below Rats.


Moving From Data to Action
It is obvious from this data that the Rats are far ahead in the effectiveness race, but why is that? What actions should Vultures and Skunks take to close the gap? What can Rats do to keep their lead?
Vultures
- Devote more time to requirements and design. Put the cowboy hats back in the closet and slow down at the beginning in order to finish fast. Use this data to convince management and customers of the need to devote more time up front, and that the division needs more of their time as well to get the requirements right.
- Devote more time to appraisal earlier in the life cycle. Higher cost per defect later in the life cycle means there is a lot of leverage in devoting time to appraisal efforts such as inspections earlier in the life cycle.
Skunks
- Time distribution to requirements and design looks pretty good, but this division needs to devote more time to early appraisals.
Rats
- Focus on improving the effectiveness of appraisal efforts. Improve containment rates in order to reduce overall cost per defect.
- Experiment with devoting more effort to appraisals early in the life cycle by carefully monitoring effort required to find a defect in each phase. Find the point of diminishing returns for each appraisal method in each phase. (How much appraisal is “enough” in each phase?)
‘Why Do We Need Metrics?’
Some may be thinking: “Ok, but we’ve know that for years – why do we need metrics?” It is true many have known for a long time that these actions should be taken. But it is also true that most organizations, and the industry as a whole, have not acted on this understanding.
The real value of metrics like those proposed here is that they help companies move beyond understanding to action. They help Six Sigma practitioners convince management and customers that changes in processes and time allocation really do benefit everybody. “Knowing is not enough – we need proof.”
For more information, read: “Core Set of Effectiveness Metrics for Software and IT“