Parts one and two of this series surveyed the work connected with several goals shared by software organizations and Six Sigma (Goals 1-3 in Table 1). We saw that reaching those goals involved establishing systems to identify defects, classify them according to type and point of origin, predict their occurrence, and assess actual defect find rates during development.
Defect Repair Costs
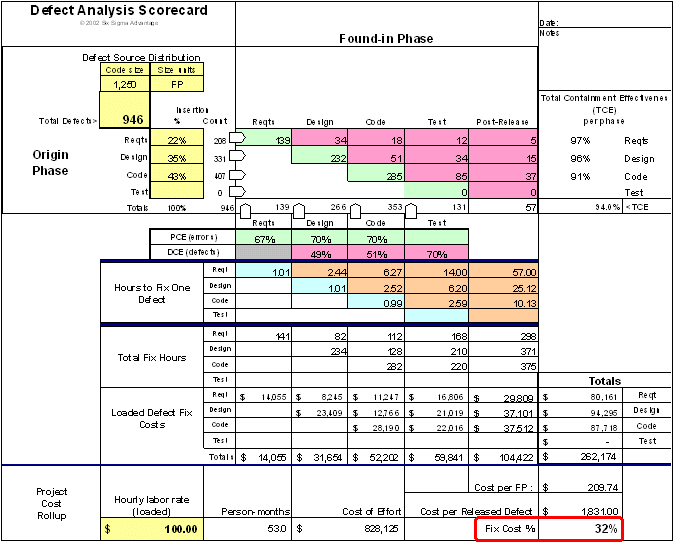
The top part of the defect analysis scorecard, introduced in part 2, predicts defect insertion and removal rates for key development activities (Figure 1). Working toward the bottom, the scorecard computes repair costs for each defect segment. This translation of defect data to dollars is an important Six Sigma step, as it gets software engineers and managers talking directly to the business in the best-understood quantitative terms. In this case, the scorecard reports defect costs at about 32 percent of the overall project cost. In many software businesses this number is considerably higher or not known with any certainty.

Similar to Six Sigma in a manufacturing environment, the business case for DMAIC (Define, Measure, Analyze, Improve, Control) projects in a software development environment focuses on uncovering, measuring, and reducing rework costs. Within the Six Sigma methodology, this is known as the hidden factory. Thinking of their organization as a factory is not necessarily popular with software developers, however the description fits as there are many interdependent processes with wasted effort and hidden defect repair costs.
Until an organization achieves Goals 1-3 and derives the business benefits associated with reduced defect repair costs, it probably isn’t ready to delve into the ins and outs of defects per unit (DPU), defects per million opportunities (DPMO) and Sigma levels. Once Goals 1-3 are achieved, the organization is prepared to tackle those Six Sigma concepts, understand how they work, and determine where they apply within the software development environment. Goals 5 and 6 will lead us to that understanding.
Goal 4: Compare Implementations Within the Company
The Defect Analysis Scorecard delivers defect counts and costs for each project. Comparing two projects using those numbers alone will not provide a sufficient comparison. Data normalization is also needed to account for differences in the each project’s size and complexity.
Sizing Software
There are two mainstream approaches for sizing software: lines of code (LOC) and function points (FP).1
LOC provides a simple way to count statements in source code text files, allowing project teams to quickly compare project sizes. Limitations of this method include the growing number of object oriented and script based environments, and the fact that LOC sizing is dependent upon the existence of code.
Function points assess prospective work product properties, such as inputs, outputs, interfaces, and complexity, assessing project size using a functional method independent of implementation. One advantage to this method is the ability to size projects early, as soon as requirements are complete. Other benefits include independence from programming languages and applicability to work products that do not fit the lines of code paradigm (e.g., data bases, Web sites, etc.).
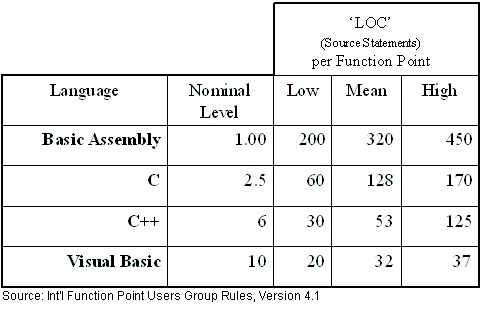
LOC and FP are both useful methods and, with a little calibration, conversion of size estimates from one to the other is easy (Table 1). The remainder of this article will focus on function points as this method is better suited to the upcoming discussion of defect opportunities.

Comparing Projects
The measure of defects per function point provides a fair comparison method for project sizing conducted with function points or a convertible equivalent. Table 2 displays information for three projects using this comparison method. Measuring defects alone unfairly singles out the Montana project as worst and Rigel as best. Lines of code could help level the first two projects, however language differences would have to be weighed as well. The fact that Visual Basic does not readily lend itself to LOC counts makes function point sizing the more appropriate common base across all three projects. When normalized by each project’s function point size, the “Released Defects/FP” metric shows Montana with the best performance.

Goal 5: Compare Implementations Across Companies
Organizations using standardized size-normalized metrics can compare results with other organizations through cross-company benchmarks. Capers Jones has published a rich set of industry benchmark data that companies can use for this purpose.
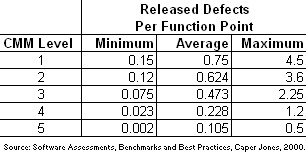
The example in Table 3 shows a range of industry benchmarks based on the “Released Defects per Function Point” measure we used for comparisons within the company in Table 2. For each CMM Maturity Level, a range of values characterizes observed performance from minimum (best) to maximum.2

Six Sigma Defect Measures
Common Six Sigma defect measures include defects per unit (DPU), defects per million opportunities (DPMO), Sigma level and Z-score. While some of these map to the software development process better than others, it is useful to understand the principles behind these measures and their software-specific application.
Defects Per Unit (DPU)
A “unit” simply refers to the bounded work-product that is delivered to a customer. In a software product, units usually exist in a hierarchy – just as the software in a ‘unit test’ (a unit at that level) may be integrated into subsystems (each one a unit at the next higher level) and finally a system (a high level Uunit).
DPU, the simplest Six Sigma measure, is calculated as total defects/total units. If 100 units are inspected and 100 defects are found, then DPU = 100/100 = 1.
Some key Six Sigma concepts and terms are built on the Poisson distribution, a math model (Equation 1) representing the way discrete events (like defects) are sprinkled throughout physical, logical, or temporal space. Sparse defects typically follow a Poisson distribution, making the model’s mapping of defect probability a useful tool. The Poisson formula predicts the probability of x defects in any particular unit, where the long-term defect rate is reflected in defects per unit.

Table 4 reflects the results of our example with 100 units and a DPU of 1 and plugging 0,1, 2, 3, and 4 as defect counts into the Poisson formula. The model maps each defect count to its probability of occurrence.

Table 4 illustrates one way to use the Poisson model to build a picture of a randomly distributed rate of defect. This picture provides a backdrop that highlights defect clustering, which is reflected in contrast to random model expectations. For example, if our actual data for 100 units showed 60 units with zero defects and others with more than expected counts, we would see that as a departure and look more closely for the cause of the clustering.
What’s Different About Software
Measuring units is a natural fit for hardware environments, where the Six Sigma challenge often involves ongoing manufacturing and delivery of similar units. Within the software development environment, the units measured vary, from low-level components to subsystems and systems. They aren’t necessarily alike and the distribution of defects among them is not necessarily well described by the Poisson model. For that reason, Six Sigma DPU processing may not fit software distribution as is.3 Still, understanding how it works helps will help you communicate with groups that do use this measure.
Looking Ahead to Part 4
In Part 4 we will broaden our understanding of Six Sigma measures and their potential applicability to software development organizations through a discussion of opportunities for defects (OFD) and Sigma levels.
Read Six Sigma Software Metrics, Part 4 »
Footnotes And References
1. Function point sizing has evolved from the work of Allan Albrecht at IBM (1979), The International Function Point Users Group (www.ifpug.com) maintains a growing body of knowledge and links to current work in the field.
2. CMM (Capability Maturity Model) is a service mark of the Software Engineering Institute (www.sei.com).
3. In cases where a software installation and even the user are considered as part of each delivered unit, the notion of different defect propensities between units is sometimes creatively mapped.
|
||||||||||||||||||||||||||||||||||||||||||