
Value stream map vs. process map, which is better for you? As with many tools and methods in Six Sigma, there isn’t a one-size-fits-all approach to mapping things out. Both of these tools have specific functions with some overlap. If you’re new to Six Sigma, then you’re in luck. Today, we’re going in-depth into how both of these tools function.
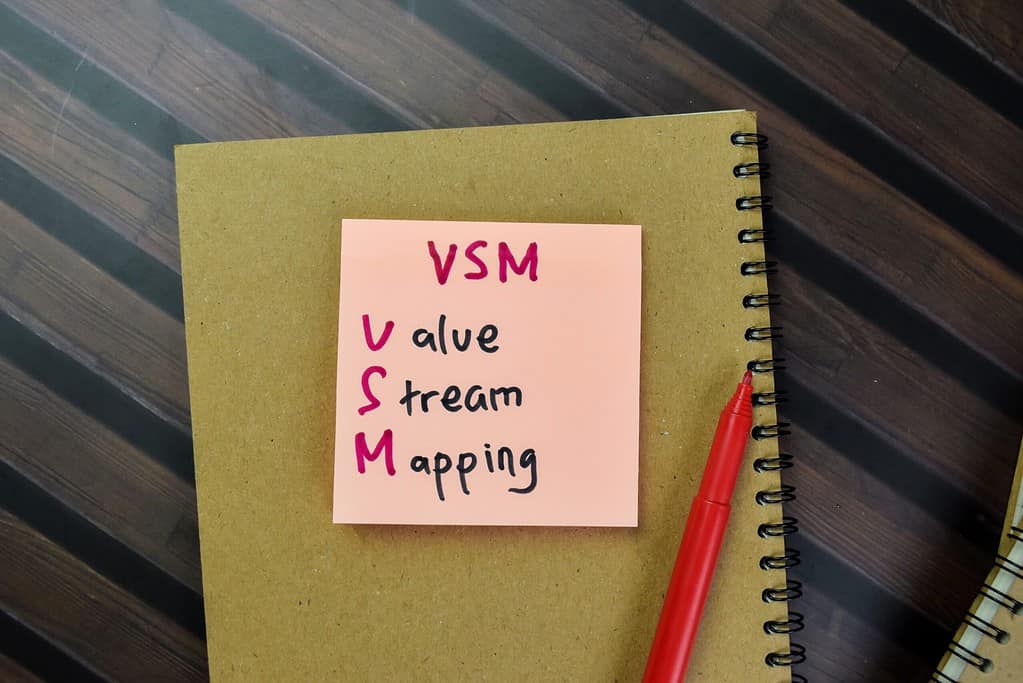
What is a Value Stream Map?
A value stream map is a visual representation of all the components that are needed to deliver a product/service. It looks at the components individually and as a whole, to eliminate waste and optimize the entire process.
The Benefits of a Value Stream Map
A value stream map diagrams both the current and ideal workflow of an item from the beginning to its completion. By including all factors and processes into one single diagram, a value stream map assists in the identification of waste throughout and leads to greater efficiency in operations. Value stream mapping helps facilitate clear communication and fosters better collaboration. It also encourages continuous improvement.
How to Create a Value Stream Map
Determine the Scope
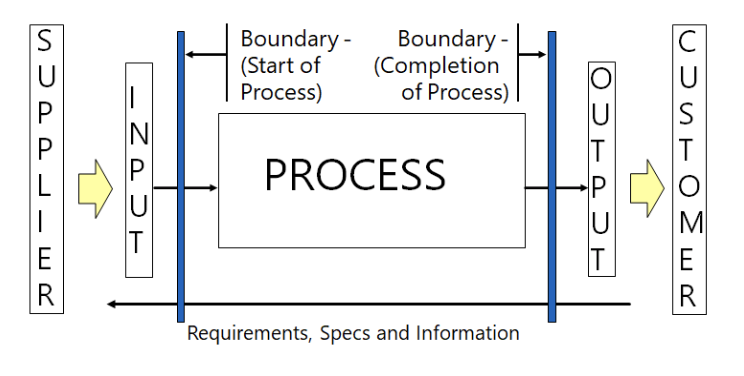
To begin a value stream map, you will want to create your start/end points. These go in the upper left and right corners of your document. If you are looking at the entire supply chain, your start point will likely be the supplier and the endpoint will likely be your customer. Next to the customer, record your takt time.
Map the Process Steps
Next, you will add process boxes to represent all the steps that are involved. In the corner of every process box, a small circle is placed that indicates the number of operators working to complete this step. Under each process box, include a data box that contains your analysis. This can be things like cycle time, changeover time, uptime, and so on.
Inventory and Wait Time
Connect the start/end and boxes with arrows to demonstrate the process flow. Thick lines represent shipments, while dotted lines represent material that is pushed from process to process. Between stages, add a triangle to mark parts you have that are works in progress at each step end. On the shipment arrows, you can add symbols to signify the mode of transportation.
Show the Flow of Information
To display the flow of information during the production process, add a production control box and add the people who are controlling the production. Add the responsibilities of the group in the second half of the box. Next, you will add lines of communication. Electronic communication is represented by jagged lines, while manual communication is represented by straight lines. You can add what, when, and how notes.
Timeline
Lastly, create a timeline at the bottom. At the bottom, write the times for processes that add value, taken from the data boxes. On the top, write times for processes that do not add value. In the data box to the right, include production lead time, value-added time, and process efficiency cycle data.
What is a Process Map?
A process map is a visual representation of all the steps in a process.
The Benefits of a Process Map
A process map displays the essential relationships between process steps so that they can be more easily understood. It also provides the benefit of allowing you to analyze how a process can be improved upon. By using a process map to show others how a process is done, greater understanding is fostered by members of a team. The map also serves as documentation of the process and as a reference.
How to Create a Process Map
First, type the name of the process that needs to be visualized at the top of your document. Next, brainstorm all the activities that you plan to include. You will then determine when the process starts and stops. Next, you will sequence your steps. After this, you will draw your flowchart symbols. Typically these are ovals for the beginning/end of a process, rectangles for an activity, arrows to show the direction of flow, diamonds for decisions, and parallelograms for inputs/outputs. Finally, you will share the map with your team to see if there is a consensus on its validity.
Value Stream Map vs. Process Map: What’s the Difference?
While a process map breaks down every step in a process, a value stream map goes further by addressing the waste between and within processes. The focus of a value stream map is on driving process change. In turn, process mapping is more suited to making current processes more efficient. A value stream map could be utilized for a process overhaul, while a process map could be used to see where adjustments could be made to existing processes instead of completely uprooting them.
Value Stream Map vs. Process Map: Who Would Use A and/or B?
A process map can be used when it is desired to see all the steps involved in a process and spot potential ways to improve an existing process. A value stream map, on the other hand, is concerned primarily with activities that do or do not add value. It is most useful for finding waste in a process and eliminating it.
Why It Matters
As we’ve gone through the ins and outs of these visualization tools, it is important to remember that these aren’t monolithic entities. As such, you are likely to encounter both of these concepts in a given workflow. However, it doesn’t answer the question of why they matter.
With this in mind, these are powerful tools for visualizing concepts. They allow everyone to get a high-level approach and deeply understand a given product or deliverable. Further, these can be useful tools for getting everyone on the same page before the establishment of given milestones and KPIs.
Choosing Between a Value Stream Map and a Process Map: Real-World Scenarios
A team leader at a manufacturing plant wants to have a clearer view of how their processes work step-by-step since the floor team is having a difficult time meeting quotas. Once the process map is complete, the team leader analyzes it and sees that there are possibly some questionable aspects of the process. Wanting to spot any waste that might be occurring, the team opts to have a value stream map created so that they may identify waste in the process so that it could be minimized.
More Useful Tools and Concepts
While we’ve honed in on the visual components necessary for making a project succeed, more tools are worthwhile when managing a project. For instance, understanding the differences in repeatability and reproducibility goes a long way. Understanding how these measurements relate to production can make or break your relationship with your customers.
Further, time is of the essence during any project. However, understanding the differences between cycle time and flow time is paramount. As such, I highly recommend our comprehensive guide on the subject.
Summary
Process maps and value stream maps are both powerful visualizations that break down the components of a process. However, if you need to look at the waste in a process so that it may be eliminated, a value stream map would be the better choice to work with.