This article proposes a method to fairly assess the value of a solution concept or even a project. Most improvement work has multiple voices that must be assessed:
- Voice of the customer (VOC)
- Voice of the process (VOP)
- Voice of the business (VOB)
The value index is a method to combine these voices to aid in decision-making – it’s another tool to have in your improvement toolbox. The value index blends concepts that most improvement professionals are already familiar with:
- Process capability
- Taguchi Loss Function
- Cost of tolerance
- Cost of implementation
Admittedly, in many projects the value is obvious, but – in those situations when it isn’t obvious – the value index can be used as a tool to prioritize efforts as well as measure optimization between performance, quality and costs.
Process Capability (Quality)
Process capability, from a conceptual view, is a measure of the relationship between VOP and VOC. It is a ratio of customer requirement (specification) and the process variation.
Process capability expresses how well a process performs relative to the VOC; it’s a prediction of how well a process will meet customer requirements in the future. A capable process is one where almost all measurements of a feature produced by the process fall inside specification limits.
The customer expects all samples to fit inside the specification limits and that the process is reasonably centered in the specification range. But not all processes are centered on the target value, which must be taken into account.
For a process:
![]()
Process capability expresses how well a process performs relative to the VOC; it’s a prediction of how well a process will meet customer requirements in the future. A capable process is one where almost all measurements of a feature produced by the process fall inside specification limits.
The customer expects all samples to fit inside the specification limits and that the process is reasonably centered in the specification range. But not all processes are centered on the target value, which must be taken into account.
For a process:
 The standard deviation is the average spread of the data about the mean. Note that USL and LSL are the points at which the customer is no longer satisfied. This view allows the concept to be applied to transactional process performance, too.
This concept assumes that a part A just under the specification is as valuable as a part at target, while a part just outside the specification is of no value. In actuality, however, the part closer to target is of highest value as downstream sub-systems, parts and features do not need to be tolerant to the extra variation of part A. The part just inside the specification and the part just outside the specification have a trivial difference in value.
Voice of the Business (Cost-Benefit)
A missing element in the assessment of process capability is VOB. Even though employees might be passionate about solving problems, making improvements and helping people be better at what they do – and find that rewarding – they work for a paycheck/benefits. Likewise, the companies themselves are in business to make money and reward shareholders. Even not-for-profit organizations need to be good stewards of money. In evaluation of solution concepts, VOB must be assessed.
It is possible to maximize either Cpk or sigma level (Z score), but if doing that has an astronomical cost, the VOB is low. Conversely, if cost is minimized, customers would be dissatisfied and would have poor value. The minimal cost would be to produce nothing, which is minimum value. Cost and quality are not independent.
To maximize long-term value, it is necessary to simultaneously minimize process variation, the difference from process average, and the target value and minimize overall cost. Value combines VOP, VOC and VOB, which can be simplified to the most benefit per dollar. This high-level concept can lead to a value index.
![]()
Taguchi Loss Function
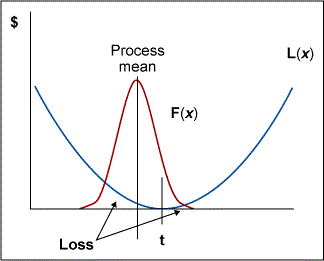
The Taguchi Loss Function is a way to assess the cost of performance relative to the customer’s target. The Taguchi Loss Function explains that as parts or services deviate from the target, the value of the part or service is diminished. The downstream process or customer must be tolerant of the deviation from the target. Taguchi calls this loss to society.
For product and or process response outputs, there is a Loss Function. The Loss Function is developed on the principles:
- Loss is minimum at the target value.
- Loss increases as the value varies from the target.
The loss function is an approximation of a Taylor series expansion around the target, τ. It should be noted that κ is a function of financial importance. If X is a feature that affects the function (life and death) of a heart-lung machine, for example, the value of κ would become large.


When the Loss Function is overlaid with the process distribution, it is easy to see why the centering of the process around the customer’s target value and minimizing the deviation about the process mean is concerning. As the spread (σ2) increases, the loss increases. And as the mean of the process moves from the target (τ), loss increases.


Pulling It All Together
Performance is the distance that the process average is from the target value: ![]() .
.
The goal is to minimize the distance, which can be expressed as ![]() .
.
The quality portion can be expressed as variation about the mean, which is variance, σ2. This should be minimized, too: ![]() .
.
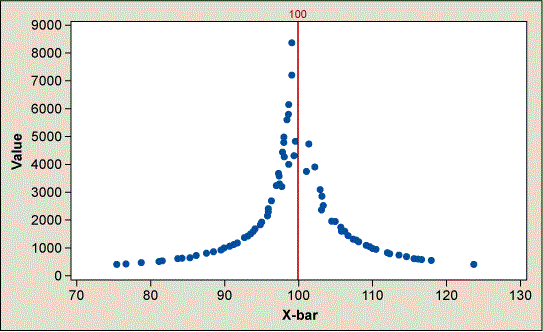
To get to value, cost must be included. Try using total lifecycle cost including bill of materials cost, process cost, capital cost, scrap cost, warranty cost, etc. As the tolerance range gets smaller, there is a greater need to be near the target with smaller variation. Of course, don’t forget to adjust for implementation cost. After some algebraic manipulation, a the-larger-the-better index is revealed. Notice the mean standard deviation (τ) is under the radical so it is in natural units; value is in terms of dollars per mean deviation from target value while costs are per unit. If a feature that has a target of 100 is simulated,
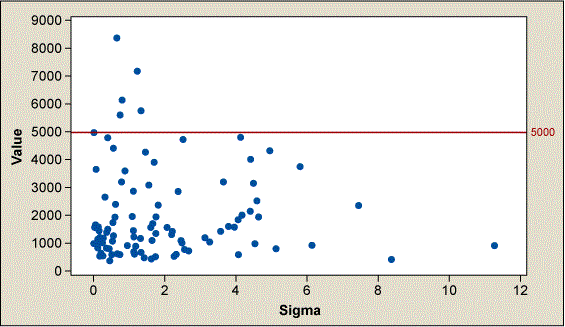
 ![]() distributes normally, costs distribute normally and sigma follows a chi-square distribution. For simplicity, the tolerance range is at 1 and IC is at 0. The best values are near the target but not the nearest to the target. The highest value isn’t the lowest cost nor is highest value at minimum variation.
distributes normally, costs distribute normally and sigma follows a chi-square distribution. For simplicity, the tolerance range is at 1 and IC is at 0. The best values are near the target but not the nearest to the target. The highest value isn’t the lowest cost nor is highest value at minimum variation.


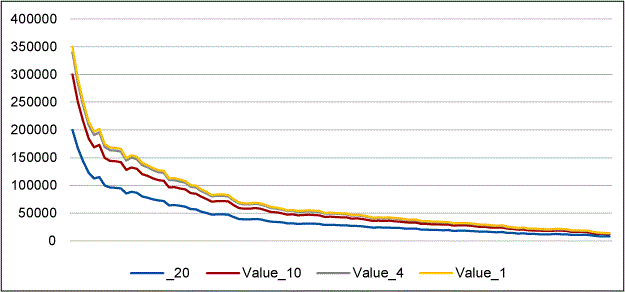
The same data with different tolerance ranges verifies that as the tolerance gets smaller, the value to reduce variation and center increases.

The value index can be used for other kinds of data that might be found in an improvement project by substituting estimates of central tendency and variation for the associated distribution. For example, if you are dealing with rates the data will most likely follow a binomial distribution, the value index then becomes:
 When dealing with counts, the value index becomes:
 The value index can allow fair comparisons across project outcomes or potential project outcomes. It could be used as a criterion in your solution selection as the value index fairly assesses benefit and cost with additional considerations of risk and time. The value index could be used as a tool to prioritize efforts as well as measuring optimization between performance, quality and costs.
In terms of per unit costs, it is possible to compare across projects by multiplying the value index by volume. This could help prioritize implementation of proposed improvements as there are always limited funds.
As statistician George E. P. Box said, “All models are wrong, but some are useful.” This value model is wrong in that it doesn’t match a balance sheet; however, it is useful in assessing the totality of a product or processes impact on customer, process and business.
References
- Understanding Statistical Process Control, Donald J. Wheeler, David S. Chambers, SPC Press 1992.
- The Certified Six Sigma Black Belt Handbook, 2nd Ed., T.M. Kubiak, Donald W. Benbow, ASQ Quality Press.
- Taguchi Methods for Robust Design, Yuin Wu, Alan Wu, ASME Press.
- Robust Engineering, Genichi Taguchi, Subir Chowdhury, Shin Taguchi, McGraw Hill, 2000.