As a Six Sigma professional responsible for managing projects, have you ever been asked the following questions?
- When do you reasonably expect to complete your project?
- What’s the probability of completing the project on time or on a given date?
- Which activities on the critical path should you focus your attention on to meet the schedule?
- Can you tell me with a 95 percent confidence level how much the project will cost?
- How much variance is associated with the total man-hours you’ve estimated for this project?
These are tough questions that require the discipline and quantitative rigor that is expected of Six Sigma practitioners. Fortunately, there is a powerful tool in the Six Sigma toolbox to help provide answers. It is called the beta distribution (also known as three-point estimation), a continuous probability distribution defined on the interval 0 and 1.
During the late 1950s, when the U.S. Navy was working on the Polaris nuclear submarine project, the Navy’s Special Projects Office developed a beta distribution tool called the program evaluation and review technique (PERT) to manage the thousands of tasks and estimates that were required for the complex project. The PERT measured three values for time estimates, cost estimates and work effort estimates (i.e., man-hours, machine hours). These values were categorized as “optimistic,” “most likely” and “pessimistic” times.
When such three-point estimation tools are combined with basic statistics (such as mean, standard deviation and Z-values), they can enhance a practitioner’s ability to better manage projects in terms of time, cost and even work effort.
Three-Point Estimation Technique
The creation of three-point estimates begins with a three-step process:
- Record the optimistic time (a): This represents the minimum reasonable period of time during which the activity can be completed. There is only a small probability – typically assumed to be less than 1 percent – that this can be achieved.
- Record the most likely time (m): This is the time required to complete an activity based on typical conditions and historical information. Since m would be the time thought most likely to be met, it is also the mode of the beta distribution.
- Record the pessimistic time (b): This is the maximum reasonable period of time the activity would need to be completed. Again, this is only a small probability – typically less than 1 percent.
This information should be gathered from those people on the project team who will perform the activity. (Note: This example uses time, but the steps can also be applied to cost or work effort.)
With the three estimates, practitioners can calculate the expected time, or weighted average of an activity, and a probability estimate of a completion time for the entire project. The following equations are used to estimate the mean (µ) and variance (σ2) of each activity:
µ = a + 4m + b6
This formula is based on the beta statistical distribution and weights the most likely time (m) four times more than either the optimistic time (a) or the pessimistic time (b).
![]()
As the equation shows, the variance is the square of one-sixth of the difference between the two extreme (optimistic and pessimistic) time estimates. The greater the difference is between these extremes, the larger the variance.
For example, assume a task has the following estimated durations:
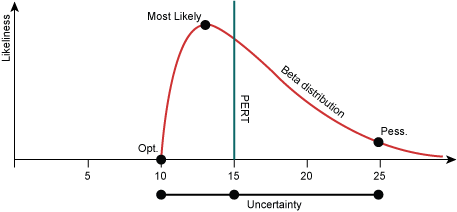
Optimistic (a) = 10 days
Most likely (m) = 13 days
Pessimistic (b) = 25 days
Using the formulas above, the expected time (µ) is calculated:
µ = 10 + (4 x 13) + 25
6
µ = 14.5 (rounded up to 15 days)
Figure 1 shows the beta distribution of this three-point estimate example.

Because variance is a squared quantity, it is difficult to interpret. To resolve this difficulty, we take the square root of σ2, which is known as the standard deviation (σ). In this example, the standard deviation is 2.5 days (σ = σ6.25 ).
![]()
σ2 = 6.25
Application with a Schedule
Now that we know the basics of the three-point estimate and beta distribution, we can apply it to a scheduling example. Figure 2 shows a simplified DMAIC (Define, Measure, Analyze, Improve, Control) project schedule using a Gantt chart.

Three time estimates were developed for each task. The optimistic schedule is 12 weeks, the most likely schedule is 16 weeks, and the pessimistic schedule is 26 weeks. Using the three-point estimation technique, we calculate the expected time of 17 weeks – slightly longer than the most likely estimate. This is due to the small differences between the optimistic and pessimistic times for most of the tasks, which indicates a higher degree of certainty.
Based on the variance, the Improve phase (σ2 = 1.78) presents the greatest risk to the schedule. As project managers, Belts should concentrate their management skills on this task to maintain the schedule.
The sequence of tasks allows the determination of the critical path – the longest sequence of connected tasks through the project, which dictates the shortest time to complete the project. If one activity must be completed before another can begin, this is called a predecessor event.
Based on the sequence of tasks in Figure 2, the critical path is A-B-C-D-E and the expected time is 17 weeks. The standard deviation of the critical path is 1.5 days (σ2.11). Using confidence intervals, a practitioner can conclude that, at a 95 percent confidence level, the average project duration can be expected to fall within 14 and 20 days [17 + (2 x 1.5)].
Another valuable aspect of using the three-point estimate is that it enables the project manager to assess the effect of uncertainty on project completion time. Suppose management asks for the probability of completing the project in 15 weeks. The mechanics of deriving this probability are as follows:
- Sum the variance values associated with each activity on the critical path. Calculate the standard deviation (σ)
- Substitute this figure, along with the project due date (X) and the project’s expected completion time (µ), into the Z transformation formula (Note: Although the beta distribution is slightly skewed, the normal distribution is a fairly good proxy for determining probability.)
Z = X – µ
σ - Calculate the value of Z, which is the number of standard deviations the project due date is from the expected completion time.
- Once Z is calculated, find the probability of meeting the project due date, using a table of normal probabilities.
In this example,
Z = 15 – 17
1.5
Z = – 1.33
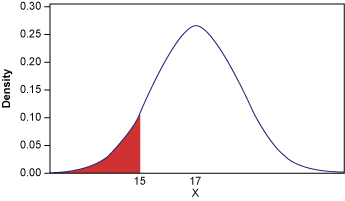
This Z score yields a probability of 9.12 percent, which means that the project manager has only about a 9 percent chance of completing the project within 15 weeks. Figure 3 shows the graphical representation of this probability. A negative Z score means the project falls on the left side of the mean. The red shaded tail area under the curve represents the 9 percent. Likewise, there is a 91 percent chance the project will take more than 15 weeks.

Likewise, what if a project manager was interested in the probability of completing the project within 18 weeks? Here is how that formula would look:
Z = 18 – 17
1.5
Z= 0.69
The positive Z score places the project on the right side of the distribution curve. This Z score yields a tail probability of 24.5 percent, which means that the project has a 75.5 percent chance of completing the project within 18 weeks.
Managing with More Certainty
A core skill of a Six Sigma practitioner is to effectively manage projects in terms of time, cost and scope (i.e., work effort). Schedules, in particular, pose unique challenges to any project manager because they must be estimated. The three-point (beta distribution) technique recognizes uncertainty in project time estimation. Coupled with basic statistics, it provides powerful quantitative tools to:
- Manage expected project completion time
- Identify tasks with the greatest risk (i.e., highest variance)
- Calculate confidence levels for expected completion time
- Provide the probability of completion on any given date
Like all tools, the three-point estimation technique has certain limitations. The accuracy attributed to the results can be no better than the accuracy inherent in the three initial points. That said, however, working with three estimates is clearly more reliable than working with just one.