
More than ever, companies today realize the importance of measurement – everything from measuring performance to measuring gap closure – in order to achieve goals. Measurement is the process of estimating the ratio of the magnitude of a quantity to a unit of the same type. A measurement is the result of such a process, normally expressed as the multiple of a real number and a unit, where the real number is the ratio. For example, nine meters is an estimate of an object’s length relative to a unit of length, one meter.
Why measure? Organizations measure for two primary reasons:
- To make a decision
- As the basis for process improvement
The act of measuring an object normally involves using a measuring instrument under “controlled” conditions. In today’s industries, the convenience of controlled conditions is seldom found. To measure accurately, measuring instruments must be carefully constructed and calibrated. Another variable of measurement systems is the human factor – the person taking the measurement when the measurement process is not automated.
All measurements have some degree of uncertainty associated with them, usually expressed as a standard error of measurement. Thus, while a measurement is usually given as a number followed by a unit, every measurement has three components – the estimate, error bounds and a probability that the actual magnitude lies within the error bounds of the estimate. For example, a measurement of a plank might result in a measurement of 9 meters plus or minus 0.01 meters, with a probability of 0.95.
Acknowledge, Accept, Then Deal with Measurement Capabilities
Organizations need to understand how good their decisions are relative to chance, and how good their decisions are relative to the true variation ofwhat is being measured. Measurement of many quantities is very difficult and prone to large error. This difficulty is due to both uncertainty and to limited time available in which to measure.
Examples of things that are difficult to measure in some respects and for some purposes include social-related items such as:
- A person’s knowledge
- A person’s feelings, emotions or beliefs
- A person’s senses
- A customer’s satisfaction
Gaining an accurate measurement can be difficult even for more physical types of data. To ensure accuracy, organizations often make repeated measurements. However, even repeated measurements will vary due to factors affecting the quantity, such as time of day, resource availability and measurement method. A company must effectively evaluate its measurement systems, especially when dealing with discrete data.
Discrete Data: Improving/Evaluating Measurement Systems
There are several ways to evaluate measurement systems, and approaches are influenced by the types of data gathered, for example, continuous or discrete data. While a gage R&R evaluates measurement systems for continuous data, attribute data can be analyzed using an attribute measurement system analysis (MSA) to deal with discrete data.
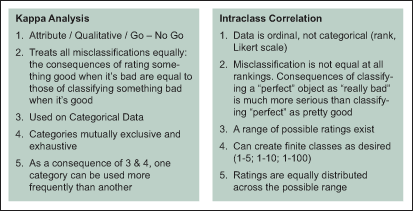
Another form of MSA can be determined through reliability coefficients. Examples include kappa analysis and intraclass correlation. Figure 1 shows the high-level distinctions between the kappa analysis and intraclass correlation.
MSA for Continuous and Discrete Data
The MSA can be generated to deal with discrete or continuous data. For continuous data, process output data is measured and re-measured to compare measurement variation to overall process variation. This “within and between” subgroup variation can be shown graphically using control chart techniques.
For discrete data, a similar approach is used. However, due to a lack of measurement discrimination it is difficult to evaluate graphically. For example, if the only measurements available were acceptable/unacceptable, how would a Six Sigma team develop an MSA study to assist and understand the problem? The following example can assist with answering this type of question.
Scenario 1: Several investment profiles were selected for evaluation by several investment brokers. Using the same profiles, a fictitious set of profiles was created using substantially the same information. A subject matter expert and qualified investment brokers then evaluated the profiles.
The MSA results were documented in Figure 2.
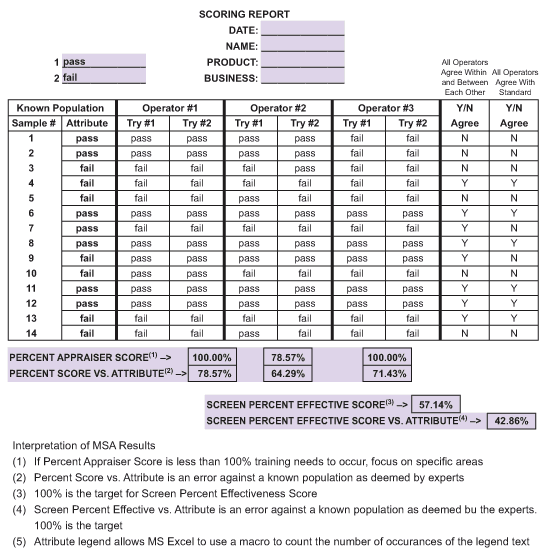
While a discrete MSA is more likely utilized in transactional processes where more data is required, it is generally less informative and can be misleading or inconclusive. In the example above, the MSA evaluation revealed that investment brokers did a poor job not only compared with one another, but also reaching the same conclusion about the same profile. One alternative is to create a scoring process similar to the score utilized for an individual credit rating. While this is a new process requiring training, the advantage is the output will behave more like continuous data, providing a situation where a gage R&R can be utilized.
When Continuous Data Is Not Available
Another statistical methodology for dealing with typical administrative measurement of attribute or ordinal data is the reliability coefficient. Essentially these tools determine whether the difference between evaluators is significant compared to random chance.
The first method, the kappa technique, evaluates classification or attribute data. Certain data collection conditions need to be met for this technique to be effective, including the same requirements as for other MSA plus some additional conditions:
- Decisions are independent of each other.
- All classifications are independent of each other.
- One classification may be used more frequently than another.
- Categories are mutually exclusive and exhaustive.
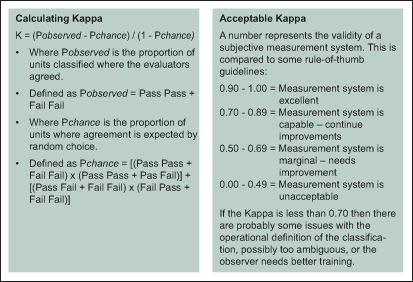
Kappa (K) is the proportion of agreement between evaluators after chance agreement has been removed. If agreement between evaluators is not good, then alpha risk (acceptable items/conditions are rejected) and beta risk (unacceptable items/conditions are accepted) errors into the collected data must be considered.
Intraclass correlation coefficient (ICC) uses reliability coefficients. This measure is better used when one can classify the data with a ranking system. Rankings may be 1 to 5 or 1 to 100 – as long as it can be considered an ordinal data set. ICC compares several different scenarios of multiple judges with multiple ranked categories. ICC uses sums of squares to accomplish this task.
The interpretation of ICC is equivalent to the kappa interpretation:
ICC >0.9 is excellent
ICC > 0.7 is acceptable
ICC < 0.7 the measurement system is inadequate
Basic formulas for ICC analysis are displayed in the following supply management example.
Scenario 2: Three senior buyers evaluate 10 purchase orders on their completeness. The ranking system used is from 1 to 10, with 1 being poor and 10 being excellent. The results are displayed in Figure 4.
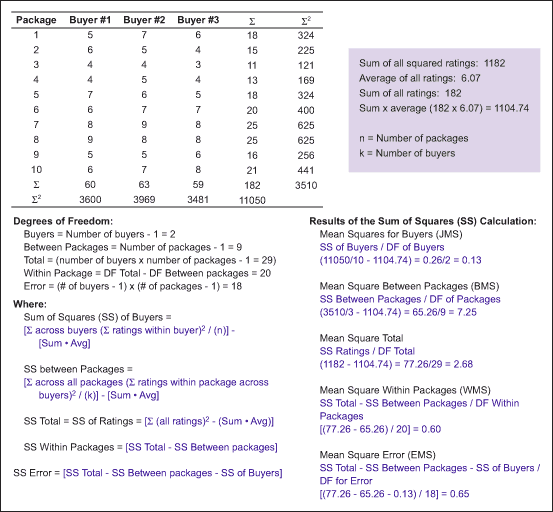
ICC uses six basic forms, each appropriate for a different situation. Using the information from Scenario 2, one can develop the appropriate ICC for the six possible ICC forms outlined in Figure 5.
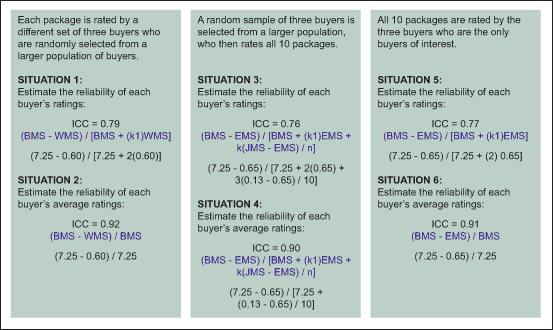
The main issue with an ICC is determining the reliability of ratings if the ratings are from a single judge or if the ratings are averaged across several judges.
- If from a single judge, situations 1, 3 and 5 apply
- If from multiple judges, situations 2, 4 and 6 apply
- Most common are situations 5 and 6, as judges (or inspectors) are usually dedicated to the task
Interpreting Results: Understanding Measurement and Data
Gaining accurate measurement can be difficult, as measurements will vary due to various factors affecting the quantity, such as time of day, resource availability and measurement method. Understanding the strengths and challenges of different measurement systems, and leveraging the appropriate standard for the current scenario is critical in analyzing measurements, and ultimately reaching the goals of the organization.