In the fourth quarter of 2010, Fairbanks Morse Engine had to swallow a tough message from its customers: You are too slow and we are not going to take it anymore! After an extensive voice of the customer (VOC) effort, it was clear that our lead times for aftermarket parts were missing customers’ expectations.
Although we had been on a continuous improvement path since 1997, many of our improvements were localized and inward facing, disconnected from our extended value stream. The VOC we received made it clear that our continuous improvement efforts had a long way to go.
To kick off the process of improving the customer experience, the executive staff did a gemba walk (observing work by walking around the area where day-to-day activities are performed) through our aftermarket value stream, from quoting to delivery, and our realizations set a path to start shrinking lead times through waste elimination. The low-hanging fruit was at the front end of the process where we engaged most with the customer. We saw opportunities in turning around accurate quotes and converting orders into value-add activities. Armed with the data from the gemba walk and with the strategy to attack the customer-facing side of the business, Fairbanks Morse was ready to further improve.
Standard Work in the Office
Standard work is a detailed definition of the most efficient method to produce a product (or perform a service) at a balanced flow to achieve a desired output rate. It breaks down the work into elements, which are sequenced, organized and repeatedly followed. It can be difficult to translate this approach outside of an assembly line environment. Each of the following elements of standard work was missing from our customer interface for quotes and orders:
- Alignment to takt time (the rate that a completed product needs to be finished in order to meet customer demand): Initially we were not aware of the customer demand for quotes and orders so we were not aligning our resources to satisfy this demand.
- Low work-in-process (WIP): We found numerous quotes and orders in various stages of completion, frequently in piles.
- First-in-first-out (FIFO) orientation: The piles of WIP were prioritized differently depending on to the person we talked with. None were oriented in a either a FIFO or date needed system.
- Single-piece flow: Like many processes, quotes and orders were performed in batches and queues rather than following a singular customer demand through to completion before moving on to the next task.
- Everything has a place: Each person’s cubicle was unique, like the person, as was their degree and style of visual management of the work, which led to confusion for others and occasionally themselves with extraneous work and clutter.
- Standard work documentation: All of the above are of little value without explicit instruction about the sequence of work steps, timing, quality checks or points of clarification, and the visual document pulling it all together so that rapid detection of abnormalities is possible.
- Key performance indicators (KPIs): Occasional lead time measurement and little root cause analysis were the norm.
Our challenge was to implement these standard work elements without sacrificing the positive personal relationships that had been developed with our customers.
Handoffs and FIFO
Office environments typically pose some challenges to the standard approach of Kaizen events in a manufacturing environment. We started with observation where the work occurred, noted the sequence of steps, timed the work on multiple occasions and then held a Kaizen event to make a step change.
Having worked in an office and other transactional environments, we knew that handoffs were problematic for short lead times. Our first step was an attempt to eliminate unnecessary handoffs or steps. This had been part of previous improvement efforts but those efforts had focused on an individual’s work speed rather than on the extended process.
Handoffs proliferated in our quoting process as multiple disciplines, departments and sometimes external suppliers were needed to properly handle the request – handoffs were the rule. In addition, we found numerous ways to hand a quote off to another party. Standardization alone dramatically reduced wait time and the need to loop back. The team designed a “paper traveler” of sorts. This document stated the issue that needed attention at the next step, which was dynamic, and included the full lineage of information for a common reference source. Errors and time wasted for an individual to figure out what was required of them and then perform that task or tasks was all but eliminated.
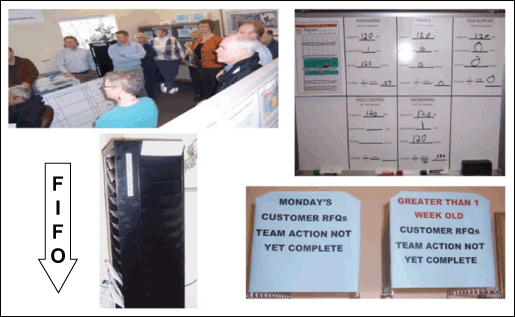
The paper solution was deliberate despite being noted as antiquated, because it was simple and, more importantly, highly visible. The previous handoff process was performed online and involved emails and phone calls, which taken altogether proved to be confusing and a time waster. The paper traveler handoffs are displayed in the FIFO lane for all to see. Our electronic order management system is our backstop in case the paper version goes missing, the bane of all card or paper systems (see Figure 1, FIFO lane).

Creating a Cell
Through direct observation of the customer service staff we noted a consistent pattern of interruptions throughout their attempts to convert an order – 70 percent of the time they were unable to convert an order without interruption. Ironically, the primary reason for the interruptions (phone calls) was to determine what was taking so long to satisfy the customer demand! Through observations, we learned that when their work was interrupted, the work typically took two to four times as long as when time was focused. It was clear we needed to address this stoppage to flow.
We chose a strategy of isolation and focus to counter the interruptions issue. Initially the concern of a reduction in the customer service level was raised, but the team worked through this – everyone had interruptions for meetings, vacation time, meals, etc. and other missed communications throughout the day. A concentrated block of time focused on meeting the demand was ultimately adopted.
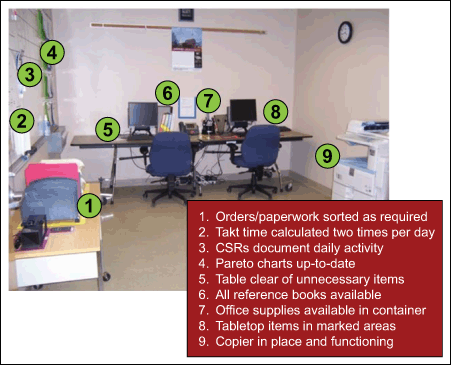
During the first Kaizen event for this problem, we took over a conference room and established a space designed just to convert orders. We developed a 5S (sort, straighten, shine, standardize, sustain) layout with everything the customer service staff would need in order to complete their work uninterrupted and in the shortest lead time possible (see Figure 2).

This dedicated and focused area is an office cell for order conversion. It has all of the elements of shop floor flow that are normally seen: takt time alignment, low WIP, FIFO orientation, single-piece flow, everything has a place, standard work documentation and KPIs. We still had the problem of unpredictable and dynamic customer demands, however, to deal with to achieve high customer service ratings.
Customer Demand Variability
Working to takt is a cornerstone of Lean philosophy. How does this take shape when your business is characterized by highly variable customer demands rather than a predictable rhythmic assembly line? Meet the spirit of working to takt first and then figure out how to adapt to this variability. Our solution was to scale our capacity to follow the customer demand as it varied.
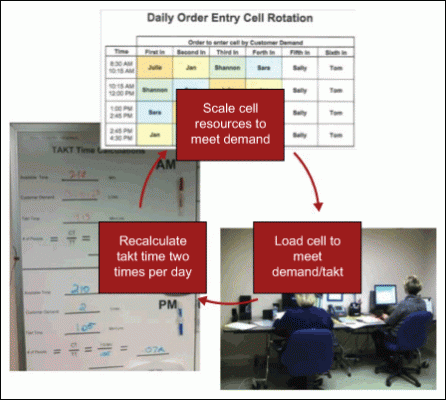
We borrowed a technique from gage repeatability and reproducibility (GR&R); we wanted to refine our measurement of this variability accurately enough that we could respond appropriately to changes. The orthodox takt calculation is typically tied to a strategic review of a value stream that happens anywhere from six months to multiple years. We observed that variability shifted within a day but not typically faster than a morning/afternoon cycle. We decided, therefore, to recalculate takt time four times per day so that both the morning and afternoon surges had a midpoint capacity check (see Figure 3).

Dynamic Scaling to Meet Customer Demand
In our gemba walk observations we heard countless stories of orders that were huge (hundreds of lines of data to enter), making it difficult to get work done in a single day. Historical data showed a more modest problem to solve – 95 percent of our orders had 10 lines or less, which typically takes minutes to complete. The frequency at which these arrived made for a manageable volume. Once the cell was activated it was easy to complete the work within a given two-hour block of time. Based on this information, we piloted a rotating, two-hour shift pattern to staff the order conversion cell with one change – we added a sequence for resource addition to dynamically scale resources to meet takt. In a matter of weeks the cell efficiency improved such that frequently the work was completed in less than the allotted two hours and workers were able to return to their desks to handle other aspects of their jobs.
Cross-training
The customer specialization that we had cultivated over the years was not going to serve us in this new process. We balanced the high-touch aspect of those relationships with the high-efficiency needs that a cell drives. Outside the cell, maintaining that specialization and strong customer relationships was critical. Within the cell, however, the work had to be standardized to the point that anyone could handle the customer demand at that particular moment.
Despite our best efforts during the Kaizen events, we were unable to standardize the process to that point because of particular customer requirements, customer operating norms and regulatory differences. Cross-training, therefore, became a mid-term focus. Process documentation of the standards, as well as the key differences, were documented and active cross-training was implemented because of the rotating personnel plan for the cells (see Figure 4).

Complexity, Hanedashi and Chaku-chaku
Complexity and time pressure tend to warp the responses of people in a process. So far, we have discussed ways to relieve time pressure when we are explicit, simple and synchronized with demand. But complexity adds subtle challenges to flow in terms of coordination between individuals or process steps as more diverse and on-demand resources are added to solve problems. We discovered that most complexity was encountered in the quoting stage. When quoting was addressed, we discovered that calculating our dynamic takt time in every two-hour shift was the best way to determine the proper cell staffing level. This was a significant culture change and required a strong, visible stance from leadership to assert through a daily quote cell meeting. Each functional area committed to supporting a customer-demand response scaling so as quotes outstripped the cycle time of the current staffing plan for the two-hour block, it was clear who was to be brought in to address the capacity gap.
All of the preceding elements are the tactical responses to a common flow problem in the office: bad handoffs. On the shop floor, the original Lean concepts from Toyota focused on hanedashi, or auto-eject. When a cell is designed, the ideal state for an operator is to ensure that value is continually added by loading parts from one machine to the next. Having machines auto-eject parts in the exact orientation that makes it safe, fast and easy for an operator to load it into the next value-adding machine has been proven as the Lean ideal.
The same idea applies to corollary activity in the office. People in an efficient office process typically add three basic types of value: 1) decisions, 2) analyses or 3) synthesis. This proved true in the Fairbanks Morse offices. Handing off customer demand between groups was a core need to complete the types of complex quotes that we received on a daily basis, but we found days’ worth of WIP between groups in their inboxes, on their desks and on their phones in the forms of questions, requests for information, approvals, etc. All of this WIP signaled an unhealthy process suffering from a lack of flow. It could be argued that cross-training could close this gap but we thought this was equivalent to saying that any part could be manufactured completely with a single, super machine. There is a point of diminishing returns when chasing cross-training. It is important to maintain specializations but work on the hanedashis.
The creation of the cells through co-location made these piles of “inventory” visible and limited. But standardizing the hanedashis between people was central so that the work done by one function was then auto-ejected to the next step in the correct form for the customer service team members to add value quickly through a decision, an analysis or by synthesizing the information in another step. By focusing on the hanedashis, office WIP in the quote cell is low and flow dramatically improved. Complexity, however, still proves to be a sizable challenge to cycle time, perhaps best handled in a separate process (see Figure 5).

An even more evolved state is the concept of a chaku-chaku cell, or the load-load cell. When the hanedashis are refined to a high degree, it is possible to string a series of load functions together for the operator. This represents the pinnacle of cellular Lean flow. The office can achieve this state as well when people not only have smooth hanedashis but also are able at a glance to add value through decisions, analyses or synthesis. This rarefied state is still a goal for us but far less of a fantasy now.
Lean Daily Management
Like all approximations of reality, our simplifying assumptions into these cells needed to be checked and corrections made. To this point, we had only made the “plan” in the plan-do-check-act (PDCA) cycle.
Key Performance Indicators
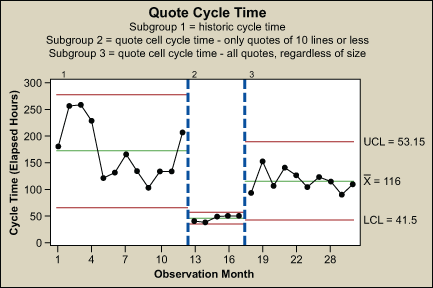
Measuring how our plan was performing was crucial. As the cells operated (“do”), knowing what to monitor for success (“check”) was as important as changing the process. We focused on two elements initially: cycle time and rework. Each function in the cells measured the time from when the customer quote or order was received (with or without acknowledgement by Fairbanks Morse) and the work was performed error free.
These were measured as daily average performance, which rolled up to weekly and monthly averages (see Figures 6 and 7). Just because we measured it, however, did not guarantee we had improved at meeting our customer demand. For that we added another dimension to the check-act phase – a daily review.


Daily Meeting
Daily review meetings are not a new concept, and their effectiveness largely depends on the intent of the meeting and the participants. We added two requirements to our standard work: 1) a daily meeting must occur to review metrics and issues, and 2) a member of senior leadership must be present to help resolve peer-to-peer conflicts. Without the latter, both of these cells likely would not have had the staying power. The importance of taking attendance and having high-level participation in customer-facing issues cannot be overstressed. The collaborative environment these requirements created was an added benefit that created openness about our performance where it was previously hidden. This was a safe environment for everyone to improve and tackle the problems together without reproach.
Root Cause Analysis-correction Cycle
With the daily meetings in full swing it was necessary to drive root cause analysis and corrective actions as a level of comfort was reached with the new process. In a matter of weeks this discipline, although part of the standard work from day one, was enforced in the daily meetings. Metering out the changes is important since teams may be overwhelmed by the changes and how to perform in a new environment. As comfort increases it is time to pay attention to the finer points.
The 50,000 Mile Checkup
The challenges for everyone in a step-change improvement is sustainment and process control. Our original goals were met, but we encountered challenges along the way – as expected. The biggest drivers for sustaining both cells since their inception were 1) the daily rhythm of measuring the lead time performance, 2) visual management and 3) management involvement. The visible commitment by leadership to reducing lead times in these processes is seen by everyone involved on a daily basis. The visible commitment to continuous improvement was also seen as process improvements were proposed and tried the same day as decisions were made in daily meetings.
Visual management tools helped show where abnormalities occurred so this level of rapid problem solving was even possible. Both the quote and order cells were set at an 80 or 95 percent customer-demand mark. Through a relentless focus on lead time, within six months 100 percent of the customer demand had entered into the normal operation of both cells.