Line balancing – the process of aligning operations within a specific production line to minimize production fluctuations and operational downtime – is often closely associated with the manufacturing sector. However, it also can be applied to any process-based organization that delivers output on a frequent basis.
Some examples where line balancing can be used in a transactional setting include:
- A production support environment, where a help desk receives requests to provide support for production
- A team of software developers working on resolving the defects reported by application users and testers
- Invoices being processed by teams to ensure that the vendor and client payments are made on time
In addition to the above transactional scenarios, line balancing, based on Lean principles, also can be deployed effectively in the information technology (IT) industry. Because line balancing requires the use of time and motion studies, it can be difficult to apply in those cases where the work elements in a process cannot be defined, such as in new product development. However, applying the line balancing approach for an IT organization involved in application maintenance and production support, rather than application development, can be achieved easily via a sequence of steps.
Line Balancing: Help Desk Support
To illustrate how Lean line balancing can work in IT, consider the following example. An organization is involved in providing production support to its business. The organization has a team engaged for resolving the issues related to several applications. The whole operation has been divided into five workstations, or places of work where processing for the job unit is done. The high level process followed by the team is as follows:
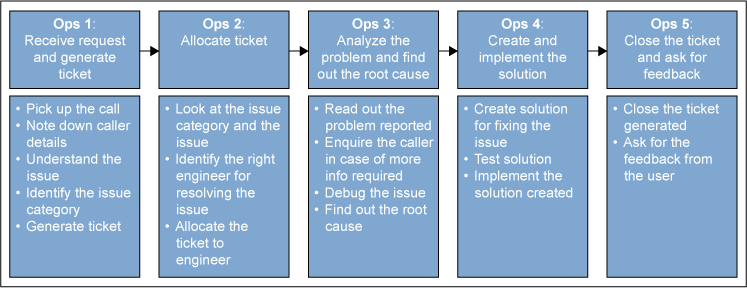
Ops1: Receive request and generate ticket
Ops2: Allocate ticket
Ops3: Analyze the problem and find the root cause
Ops4: Create and implement a solution
Ops5: Close the ticket and ask for feedback
To complete the task of line balancing, the team undergoes the following eight-step exercise:
Step 1: Understand the Takt Time
To move forward with line balancing, it is necessary to understand the rate of customer demand and the time that is needed to complete a process. Lean provides a good metric for this in the form of takt time, which is the throughput rate at which customers can expect the products or service to be delivered.
The formula used for calculating takt time is:
Takt time = Available working time / count of units demanded by customer
Takt time is used for deciding the maximum throughput rate a process can agree to deliver.
In the IT help desk example, the total number of ticket closures, as agreed upon with the client organization, is 20 per day. The total working time in a day is 8.5 hours, or 510 minutes. The available working time, excluding the one-hour lunch and two 15-minute breaks, comes to 420 minutes per day. Hence:
Takt time = 420/20 = 21 minutes per ticket
This means that a throughput rate of 21 minutes per ticket should be maintained for meeting the customer demand for the closure of 20 tickets a day.
Step 2: Create a Process Top-down Chart
To ensure a balanced line, it is imperative to understand the relationship and the sequencing between different activities in a process. Creating top-down chart provides a method to identify the sequencing relationship between the process activities.
Figure 1 depicts the top-down chart created by the IT process team, based on the activities carried out in the process.

Step 3: Understand the Time Required for Process Activities
An efficient line balancing must take into account the effort required to carry out various necessary process activities. This determination can be done using the time and motion study for the activities carried out in the process. Some caution points for carrying out the time and motion study are:
- Take a sufficient number of samples to reach to a deterministic number for the activity time.
- The mode can be a better measure of acceptable time for the activity rather than the mean.
- Time and motion studies should be done for one product family rather than a group of product families.
The time calculated to complete the process activities should be used to calculate the total cycle time (the total time taken to perform work on the product from start to finish, including processing time and delays) and the processing time (the touch time during which the product is worked upon, including value-added and non-value-added time) at each workstation.
In this IT example, the process team goes ahead with the time and motion study and gets a feel of the time consumed in each process block. The time details can be seen in the table below.
Time Details
| Ops1 | 10 minutes |
| Ops2 | 5 minutes |
| Ops3 | 25 minutes |
| Ops4 | 20 minutes |
| Ops5 | 15 minutes |
| Total cycle time | 75 minutes |
Step 4: Establish “As Is” Relationship: Takt Time vs. Cycle Time
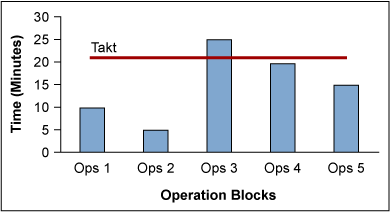
Based on the calculation done for takt time and the cycle time for the process, a graphical representation in the form of time bar graph can be produced, clearly showing the gap between the takt time and the operation time of the process blocks (see Figure 2).

Step 5: Calculate the Number of Workstations Required
The takt time and the cycle time calculated for the “as-is” process provides an opportunity to calculate the required number of workstations. The formula for this is:
Number of workstations = (total cycle time * K) / takt time
where K is the empirical multiplying factor representing the process inefficiency. The value of K can be around 1.1 to 1.2.
Based on the takt time and the cycle time data in the IT example, and considering K = 1.1, the number of workstations can be calculated as:
No. of leveled workstations = 75 * 1.1/ 21 = 3.9
Hence the process should not have more than four workstations to complete the process.
Step 6: Identify Areas of Inefficiencies
The takt time vs. cycle time bar graph in Figure 2 provides an opportunity to identify two important aspects of this process: 1) the maximum throughput rate that can be achieved with the existing process by identifying the longest bar in the graph, and 2) the zones of inefficiencies in terms of the idle time and possible instances of work in process (WIPs).
In the given IT example, the team determined that:
- Because the largest time block is 25 minutes, the process can never give a throughput rate better than 25 minutes per ticket and thus will not be in a position to meet the takt time ticket closure in 21 minutes.
- For those workstations where the bars are less than the takt time, they can expect idle time for the resources engaged.
- For those workstations where the time bar graph is greater than the takt time, they can expect WIP before that bar and also overtime for the resources engaged.
Step 7: Conceptualize a Restructuring of Activities
To balance the work load, a restructuring of the process activities is needed, requiring consideration of the constraints of accumulation and segregation of the work activities. While restructuring is being done, process teams need to take care of activities that:
- Cannot be done together
- Have to be done together and cannot be separated
- Can be done only by a specific resource
Considering these constraints, the actions that should be taken are:
- Combine the activities so that the time taken by any workstation is not more than the takt time calculated.
- Identify the activities that either can be removed or can be done faster by utilizing different techniques. For example: Tickets being allocated manually can be allocated automatically, or data that is being entered manually can be populated using macros.
The IT process in this example provides a few opportunities for improvement. The objective of the improvements to be made are:
Objective 1: The number of workstations should not be more than four.
Objective 2: The time taken by each process block should not be more than 21 minutes.
Considering these objectives, the following changes can be made in the process:
- Change the operation so that Ops1 and Ops2 are done by the same workstation. Some extra resources may need to be allocated to complete this process.
- Allocation of resources may also be automated depending on the issue category and the engineers’ availability.
- The time for Ops3 completion should be reduced so that it is not more than 21 minutes. This can be achieved by making more specific information available to engineers.
Step 8: Demonstrate How the Improved Process Performs
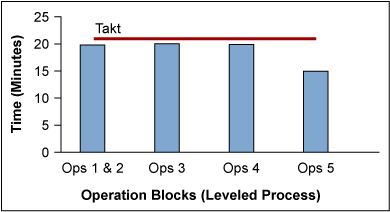
After making the improvements, the time bar graph should be used for representing the takt time and cycle time of the balanced process (see Figure 3).

Note that in the new design in Figure 3, there is no change in the total cycle time of the process. The leveling has been achieved only by restructuring the process activity elements. Further improvements can be made by reducing the activity time of the process, which will result in a more efficient process.
Metrics Impacted
Line balancing helps in achieving an efficient line, which utilizes resources proportionately. Line efficiency is one metric that can be used for measuring the improvement achieved through line balancing.
Line efficiency can be calculated by using the formula:
Line efficiency = (Total cycle time ) / (No. of workstations * Takt time )
For the IT case described above:
Line efficiency before balancing = 75/ (5*21) = 0.7142 = 71.42%
Line efficiency after balancing = 75/ (4*21) = 0.8928 = 89.28%
By using line balancing and Lean techniques, practitioners can better calculate the time and effort needed to complete their products or services, and also utilize their resources to the fullest to produce the output demanded by the customer.