Lean can be applied to any industry, not just manufacturing, because any business can benefit from improvements in cycle time, cost savings, productivity, efficiency and more. This case study examines the application of Lean to the engineering services industry in the areas of design, analysis and prototyping of parts to realize improvements in a subprocess of the new product development (NPD) lifecycle.
Lean Principles
There are five general principles in Lean:
- Identify customers and specify value: From the standpoint of the end customer, specify value by product or service group.
- Identify and map the value stream: Identify all of the steps in the value stream for each product or service, eliminating when possible the steps that do not create value.
- Create flow by eliminating waste: Make the value-creating steps occur in tight sequence so that the product or service will flow smoothly toward the customer.
- Respond to customer pull: As flow is introduced, let customers pull value from the next upstream activity.
- Pursue perfection: As value is specified, value streams are identified, wasted steps are removed, and flow and pull are introduced. Begin the process again and continue cycling through until a state of perfection is reached in which perfect value is created with no waste.
Simply put, Lean minimizes inputs and maximizes outputs at every process step.
Example: New Product Development in Design Department
The NPD process in this example of applying Lean to a nonmanufacturing setting is in the design department of an organization. It represents part of the overall project management lifecycle. A macro-level process map of the NPD process is shown in Figure 1.
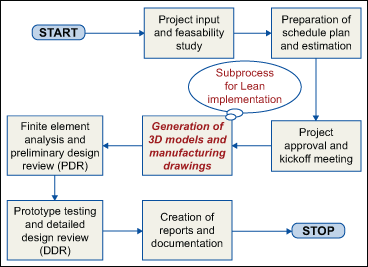
Since NPD activity involves many subprocesses, only one was selected for the pilot project. The subprocess under study was generation of 3D models and manufacturing drawings of the various parts that go into the manufacturing of prototypes. The metrics being monitored were cost of quality (COQ), cycle time and lead time.
The data captured to calculate the COQ were the total hours taken to carry out the quality check of the model and drawing, the total hours taken to carry out the rework identified during the peer review stages, and the actual total hours taken to complete the project.
COQ = (total quality check hours + rework hours) * 100 / total actual hours
Where COQ is expressed as a percentage of the total project cost
The cycle time clock starts when work begins on the request and ends when the item is ready for delivery or the task is completed. Lead time (also referred to as throughput or turnaround time) is the average time it takes for one unit of the product or service to go through the entire process – from start to finish – including time waiting between subprocesses.
Lead time = sum of all subprocess lead times + sum of all wait times between subprocesses
Once the subprocess for Lean implementation was identified, the five Lean principles were mapped as appropriate.
- Identify customers and specify value: The customers were identified as internal customers from departments to whom the CAD (computer-aided design) models and drawings were being delivered.
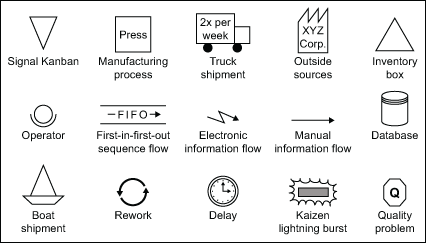
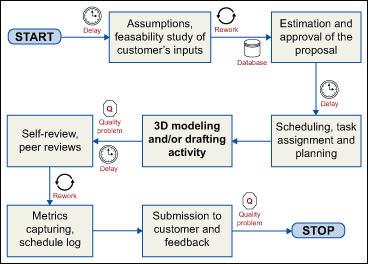
- Identify and map the value stream: The value stream was mapped and the as-is process map is shown in Figure 3. (Note: Figure 2 provides a legend for the symbols used in Figures 3 and 4.)
- Create flow by eliminating waste: The areas of waste and non-value added (NVA) activities were identified (such as idle time, waiting for submissions, etc.), and appropriate actions were taken (such as automation, training, database creation, etc.) to minimize and eliminate the waste. Figure 4 shows a revised process map with these improvements incorporated.
- Respond to customer pull: Delivery target dates were set as internal targets and the schedule was developed by working backwards to ensure that the waiting time and delays were minimized. This is similar to the pull system in a manufacturing setting with the immediate customer setting the target dates for delivery based on the project’s overall schedule.
- Pursue perfection: The optimized process map was set as the new baseline to further improve. The metrics collected were continuously monitored to ensure the health of the process.
Value Additions
A number of value-add activities were implemented to facilitate the improvements in the 3D modeling process.
- Automation of the job submission process was introduced to speed up the work assignments and to avoid delays and wait times. This automation enhanced the work scheduling and allocation activity.
- Automation of the peer review submission process was achieved through product data management, which avoids the submissions’ being overlooked and helped avoid delays and wait times.
- Automation of the drawing checking process (with respect to using spell check and implementing standards) to reduce the cycle time of self-reviews and peer reviews and to avoid defects.
- Elimination and/or reduction of the NVA intermediate steps (such as rework) using the above automations to avoid delays.
- Creation of a database helped generate and report the requisite metrics to top management and to the customer. Review steps took advantage of the easy access and speedy retrieval of data.
- Training in some modeling and drafting activities for all stakeholders was implemented to improve team members’ skill sets. This led to enhanced efficiency and productivity by way of fewer defects, improved first pass yield and shorter cycle times.
- Institutionalized best practices and lessons learned were documented and used to train new team members. Overall, this helped sustain the maturity level of the process.
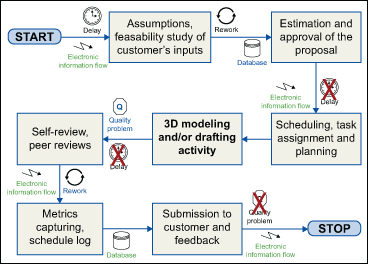
After implementing Lean, some pockets of delay, rework and quality problems remain. Those pockets will be further optimized during subsequent process improvement cycles.
A Taste of the Benefits
The table below offers a glimpse into the benefits that were derived out of this particular LSS application.
| Benefits of Lean Implementation | ||
|
Evaluating Factors |
Before Lean Implementation |
After Lean Implementation |
| Number of subprocesses |
18 |
11 |
| Number of delay times/waiting periods |
9 |
4 |
| Information flow (automation touch points) |
3 |
8 |
| Database availability/use |
1 |
3 |
| Cycle time (in minutes) |
130 |
90 |
| Lead time (in minutes) |
200 |
130 |
| COQ (percent) |
20 |
11 |
Another way of expressing these improvements is the following:
- An average of reduction of 40 minutes was realized per 3D model. This amounts to a 30-percent reduction in the cycle time per model.
- Assuming an average workload of about 300 models per month with a given team size of six, the total hours saved are about 200 – or 25 working days (8 hours per day) per month. Assuming an average hourly rate of $20 for team members, an additional $4,000 revenue was added to the bottom line each month.
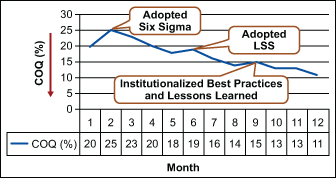
The timeline shown in Figure 5 tracks the application of LSS as it contributes to the reduction of COQ.
