At the core of Six Sigma lies the continuous drive to reduce the cost of poor quality (COPQ), and it often takes center stage when making the business case for continuous improvement projects. Its components include aspects of operations such as scrap, rework and costly customer returns. In the wake of the current global economic crisis, it has never been more important to minimize the burden COPQ places on the viability of a business.
Unfortunately, one area that has a significant effect on COPQ is often overlooked in continuous improvement projects: the thresholds used to determine whether a product is at an acceptable quality level. When people think of thresholds, they may conjure up images of machinery. Yet thresholds are used either consciously or unconsciously in most every type of decision making, most of which are non-industrial related.
Practitioners often assume that the thresholds in place were set correctly. Yet a routine investigation into the current threshold will often be met with the following results:
- The person who originally chose the threshold level is no longer with the company.
- There is little or no documentation outlining how the level was chosen.
- The threshold is not set at an optimal level.
Therefore, practitioners may find savings by taking a closer look at quality thresholds. The following case study illustrates how changing thresholds can impact COPQ.
Case Study: Bearings Diameter Thresholds
In a facility that manufactures bearings, a new Black Belt was under pressure to present a solution that could reduce the current COPQ. By conducting some intermediate statistical analysis, the Belt identified the optimal threshold setting.
Production
Annual production was 10,000 bearings, with a mean diameter of 100 cm, standard deviation of 2 cm, and customer specification limits of 94 cm (lower) and 106 cm (upper).
Costs
The company faced an internal scrap cost of $9,800 per unit if bearings did not conform to customer specifications. An external cost of $19,950 per unit was lost if a unit was returned by the customer.
Problem
The yield of this process was 99.73 percent, meaning the internal scrap costs equaled:
27 units x $9,800 = $264,600
However, in addition to this internal cost, the facility had experienced approximately 50 units that failed in the field (FIF) and resulted in customer returns equal to:
50 x $19,950 = $997,500
Therefore, total COPQ was $1,262,100.
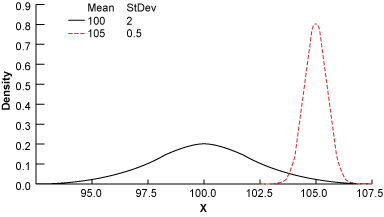
This pattern of 50 customer returns annually had persisted for several years. In an attempt to identify the root cause behind the failure, all 50 returned units this time were to be sent to the lab for chemical analysis. However, before sending them to the lab, the Belt discovered that these returned bearings had one thing in common: their diameter. Data analysis concluded that the FIF units had a mean diameter of 105 cm, with a standard deviation of 0.5 cm. The Belt depicted this situation using a distribution plot (Figure 1).

Results from the chemical analysis in the lab were not expected for weeks or possibly months. Although the results could provide a root cause, it was possible they would not. The Belt needed to create a more immediate plan of action to reduce the amount of FIFs and the COPQ.
The options for controlling variables in this situation were limited. It was apparent that by conducting some what-if analysis regarding the establishment of a tighter upper specification limit, the Belt might be able to cut off part of the tail of the FIF distribution. However, by implementing a tighter spec, the Belt would also increase internal scrap. To find the net effect on COPQ of altering the specification limit, the Belt needed to conduct some spreadsheet modeling and simulation.
Before performing any calculations on the FIF distribution, the Belt first conducted a t-test to see if it was reasonable to treat the 50 FIF units as a separate distribution. In this case, the t-statistic exceeded 16 (highly significant). This told the Belt that performing calculations on the FIF distribution was reasonable.
Conducting Threshold Analysis
The first step in the threshold analysis was choosing a range, between which the net effect on COPQ could be tested. In this case, the Belt set the range to be 104.9 cm to 106 cm, in 0.1 cm increments. Next, the Belt constructed a table that would capture all of the contributing factors. As the upper specification moved inward toward 104.9, the Belt calculated how much the cost of scrap was increasing and how much the cost of FIFs was decreasing (Table 1).
| Table 1: Cost of Scrap and FIFs with Different Thresholds | ||||||||
| Threshold | Percent of Product Scrap Due to Internal Threshold | Scrapped Units (Upper Spec) | Upper Spec Scrap Cost (Units x $9,800) | Percent of FIFs Shipped | FIF Units | FIF Cost (Units x $19,950) | Add Scrap Cost from Lower Spec | Cost of Poor Quality |
| 104.9 | 0.7 percent | 71 | $699,995 | 42 percent | 22 | $442,411 | $132,290 | $1,274,697 |
| 105 | 0.6 percent | 62 | $608,547 | 50 percent | 26 | $521,473 | $132,290 | $1,262,310 |
| 105.1 | 0.5 percent | 54 | $527,842 | 58 percent | 30 | $600,535 | $132,290 | $1,260,667 |
| 105.2 | 0.4 percent | 47 | $456,796 | 66 percent | 34 | $676,506 | $132,290 | $1,265,593 |
| 105.3 | 0.3 percent | 40 | $394,410 | 73 percent | 37 | $746,656 | $132,290 | $1,273,355 |
| 105.4 | 0.3 percent | 35 | $339,763 | 79 percent | 41 | $808,897 | $132,290 | $1,280,951 |
| 105.5 | 0.3 percent | 30 | $292,017 | 84 percent | 43 | $861,964 | $132,290 | $1,286,271 |
| 105.6 | 0.3 percent | 26 | $250,403 | 88 percent | 45 | $905,441 | $132,290 | $1,288,134 |
| 105.7 | 0.2 percent | 22 | $214,224 | 92 percent | 47 | $939,668 | $132,290 | $1,286,183 |
| 105.8 | 0.2 percent | 19 | $182,850 | 95 percent | 48 | $965,561 | $132,290 | $1,280,700 |
| 105.9 | 0.2 percent | 16 | $155,709 | 96 percent | 49 | $984,383 | $132,290 | $1,272,382 |
| 106 | 0.1 percent | 13 | $132,290 | 98 percent | 50 | $997,530 | $132,290 | $1,262,110 |
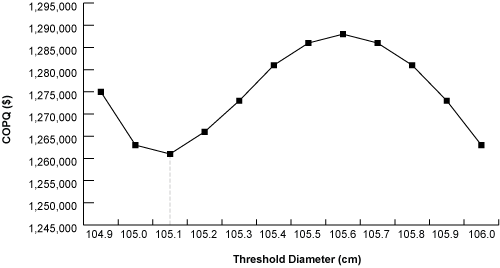
The Belt evaluated the results across the range of 106 cm to 104.9 cm and noticed that by slowly moving an internal threshold inward to a value of 105.1 cm, the company could reduce its COPQ by more than $2,000 while at the same time reducing the projected annual customer returns from 50 units to 30 units, a decrease of 40 percent. To get an idea of the entire output space, the Belt graphed the spectrum of COPQ for all threshold levels (Figure 2).

Yielding Results
Threshold investigations should be an integral part of any continuous improvement program. By optimizing thresholds, Belts can yield incredibly significant and immediate results because thresholds directly affect scrap and lost sales. Belts should consider looking around their local areas and inquiring into how the thresholds in their environment were derived – they might just be surprised with what they find.