In this case study, the 509th Maintenance Group of the U.S. Air Force used an eight-step continuous improvement approach to balance its resources and meet both flying hour program requirements and aircraft availability. Part 1 focused on steps 1 through 4. Part 2 looks at continuing to make improvements with steps 5 through 8.
Step 5: Develop Countermeasures
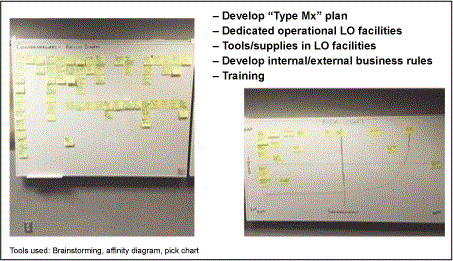
Developing countermeasures proved to be a difficult step to complete. The team consisted of multiple SMEs from across the maintenance complex, and their individual traits, reasons for involvement and resistance to change made this step challenging to say the least. Interpersonal communication skills and change management techniques played a large role in assisting the facilitator. In the end, the team decided on five major changes to the existing way of conducting business:
- Develop a type maintenance plan.
- Dedicate aircraft hangars to “LO maintenance only.”
- Dedicate tools and supplies to those hangars.
- Develop internal and external business rules to facilitate the heavy LO restoration process.
- Training the LO maintainers as well as crew leaders, managers and leadership.
Each of the countermeasures was based off root causes identified during root cause analysis and tested the team’s problem-solving abilities. Once again, the team was able to be creative and involved in providing a solution. Once countermeasures were developed, a pick chart was employed as a mechanism to evaluate impact versus ease of implementation. The tools used to develop these countermeasures were brainstorming, affinity diagrams and a pick chart. Figure 7 depicts the results.
Step 6: See Countermeasures Through
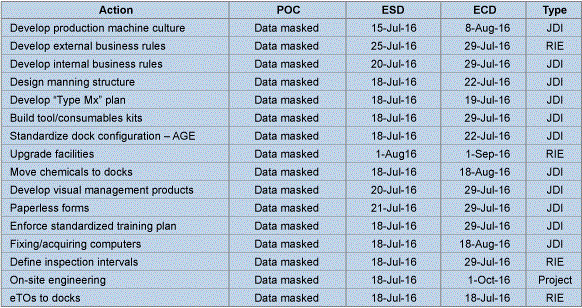
Once the various countermeasures were evaluated based on impact and ease of implementation, the team began to develop an action plan. The action plan consisted of multiple COAs and ranged from small, internal objectives such as just do it (JDI), rapid improvement events (RIEs) to projects. It was important to identify the level of involvement as each COA was important to the LOPM since the resulting improvement can vary from an internal LO flight policy change to inter-command level resource allocation. The COA provided each person (volunteer) assigned a task an estimated time of completion date. In the post-improvement phase, the document also provides a level of accountability as the team knows who to contact when/if a problem arises that requires attention. Figure 8 depicts the results.
Acronyms
- AA, aircraft availability
- AFSC, Air Force Sustainment Center
- BW, Bomb Wing
- COA, course of action
- CPI, continuous process improvement
- FHP, flying hour program
- HPO, hourly post flight
- LO, low observable
- LOPM, low observable production machine
- MXG, Maintenance Group
- PDM, programmed depot maintenance
- SME, subject matter experts
Step 7: Confirm Results and Process
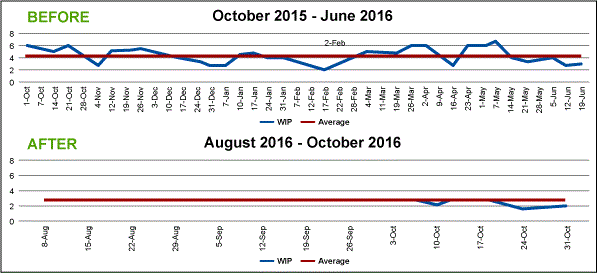
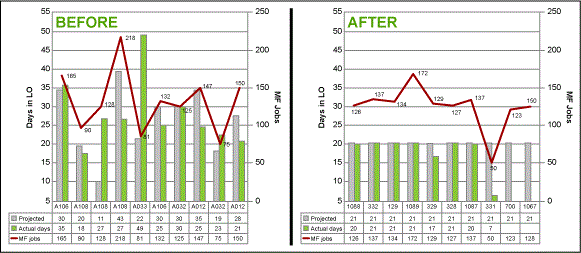
Confirming results and processes is the next step in the 8-step model. To do this, the team needed to compare the current-state performance to post LO production machine stand-up performance. Prior to standing up the machine, the 509th MXG wanted to reduce WIP variability and reduce average WIP from approximately five to three. They also wanted to reduce flowday variability and reduce flowday average from a peak of 45 days to 21 days. Finally, the ultimate goal was to provide a suitable fleet health posture able to meet wartime requirements and flying hour program goals. Figures 9 and 10 provide a graphical representation of the results over the first three months of implementation. It is important to note during this step the basis of this event was to take a deep dive in how the 509th MXS operates and how they can perform better. While the results conclude the objectives of reduced WIP and WIP variability have been met, the team continues to find new areas in which it can improve the machine and the quality of life for the 509th MXS LO maintainers.
Step 8: Standardize Successful Processes
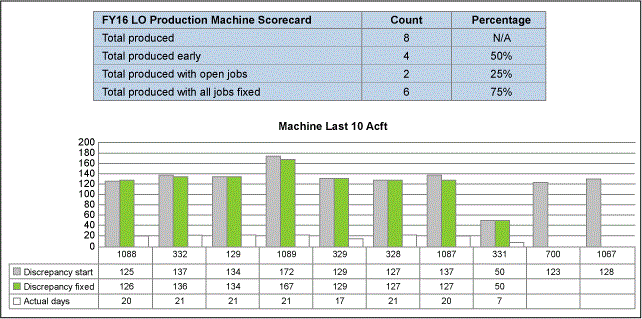
In essence, the LOPM was based off a standardized successful process as we adopted an aircraft depot methodology and applied it to a field-level maintenance activity. This application will not only benefit the B-2 program but can apply to other airframes with unique requirements requiring similarly large downtime commitments. With the new B-21 raider (long-range stealth strategic bomber) contract being awarded, it gives the 509th MXG the opportunity to reach out into future enterprises and share lessons learned to airframes that may run into the same problems they have encountered. As a measure of success, the LO production machine scorecard (Figure 11) will be used to share with other units the benefits of standing up a production machine with a gated concept.
Visual Displays
Perhaps one of the most important aspects of the AFSC production machine concept is the use of visual displays. By implementing factors such as standard work and visual displays, the AFSC is able to accurately measure and monitor throughput. Paramount to a production machine is the element of standard work and designing repeatable methods of accomplishing tasks. In most cases, standard work is inherent to aircraft maintenance in the form technical data publications which specifically detail steps of a repair process. However, the AFSC (and the LOPM) takes the standard work methodology a step further by creating a script that is able to communicate when a particular task is performed. Paramount to this idea is information sharing. Two levels of visual displays are used and are easily understood by everyone from floor workers to top managers and senior leaders. By creating visual displays that adhere to the basic elements of relevancy, simplicity and accuracy, the AFSC has created an information delivery system that is simple and straightforward.
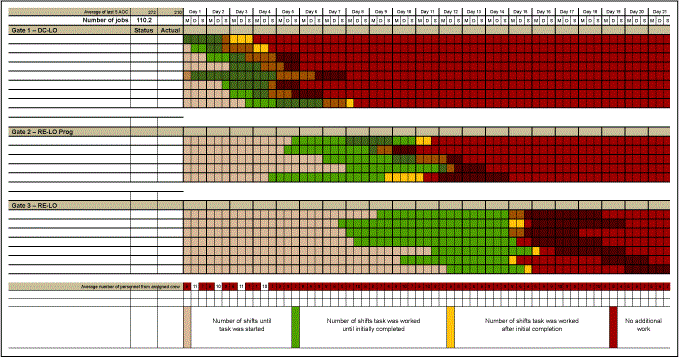
Perhaps one of the most effective forms of visual display is the production status display or “waterfall” chart. The waterfall chart (Figure 12) expands on the production machine approach by tracking progress of individual pieces and providing status according to their performance along the predetermined critical path. A basic waterfall chart will consider one of three statuses: green (on time), yellow (potentially late) and red (late). When a task is green, the machine is behaving normally and business is good. When a yellow is encountered, the team begins to examine causal factors that impacted the regression. Nothing is changed during a yellow status as the piece still performs according the critical path; however, preparations are made to understand why. During a red scenario, constraints to the critical path are examined and a CPI event might be generated to resolve the situation. It is important to note that a red status is not considered detrimental or negative; this is simply a trigger point in which it is understood that an opportunity exists to improve and become more effective.
Conclusion
Through the power of reduced variability and CPI methodology it is possible to create a system that is able to produce unprecedented results and provide an improved quality of life for those involved. While the production machine philosophy was first realized by the AFSC in an aircraft depot environment, its application to field-level repairs and restoration provide an operational wing with the ability to better use resources and apply manpower. Furthermore, leadership sponsoring of CPI events builds a culture that promotes commitment and continuous improvement. In summary, the efforts of the LOPM has provided aircraft critical to national security, an increased readiness posture and improved working conditions for more than 250 airmen.