The diagnostic testing center at Northwestern Memorial Hospital in Chicago is an outpatient laboratory that is kept perennially busy serving the needs of the community. Thousands of walk-in patients are seen each year, primarily for blood tests (phlebotomy) and electrocardiograms (EKGs).
Although Northwestern receives acclaim for its patient care, some complaints had begun to surface regarding the amount of time patients were waiting to be seen in the diagnostic testing center. A high degree of variability in wait times, ranging from 30 to 60 minutes during peak patient volume, was causing unpredictability and dissatisfaction from both patients and physicians. To improve service quality and raise satisfaction ratings, the staff began to seek solutions to this problem.
About Northwestern Memorial Hospital
A renowned academic medical facility, Northwestern Memorial Hospital is the primary teaching hospital of Northwestern University’s Feinberg School of Medicine and a major Midwest referral center. More than 1,400 physicians representing every specialty are affiliated with the hospital.
Fiscal Year 2003 Statistics
Inpatient admissions: 40,901
Patient days: 197,886
Average daily census: 556
Average stay (days): 4.84
Deliveries: 9,464
Outpatient registrations: 364,692
Surgical cases, inpatient: 11,120
Surgical cases, outpatient: 16,875
Emergency room visits: 68,092
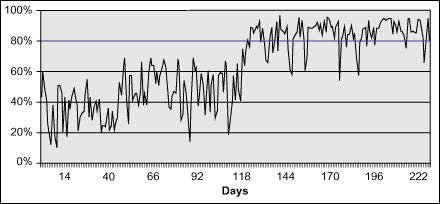
For the past few years, the hospital has used Six Sigma as part of its overall performance improvement approach. The hospital put a team together and began a Six Sigma DMAIC project aimed at reducing patient wait times in the diagnostic testing center. Specifically, the goal was to be able to see 80 percent of the patients within 20 minutes of when they entered the center. This was deemed “reasonable,” according to patient and physician surveys and interviews conducted during the Measure phase of the project. As the project began, the testing center was seeing only 44 percent of the patients in this timeframe. In addition to reducing wait time, the team also sought to raise satisfaction ratings and standardize outpatient laboratory ordering by creating an updated laboratory order form and discouraging the use of physician scripts.
Process Exam
The first order of business was to give the whole registration process a thorough examination. Typically, walk-in patients would present their physician’s lab orders and their insurance information, and an appointment would be made in the hospital’s scheduling system. Lab orders would be entered in the computer and the patient would be summoned into an open exam room by the next available phlebotomist. Registration would be completed either while the patient was waiting or during the procedure.
Steps taken during the Define phase included developing a project charter, performing stakeholder and resistance analyses and creating a threat-versus-opportunity matrix. The team began process mapping with the SIPOC tool, but in this particular case it turned out to be an ineffective strategy.
As the team began documenting the numerous details involved with the registration process, it realized it was somehow missing the big picture. At one time, the team had more than 100 sticky notes on the wall and still had not gotten to the point where the patient enters the picture. Non-value-added steps were popping up everywhere. This looked like a job for Lean.

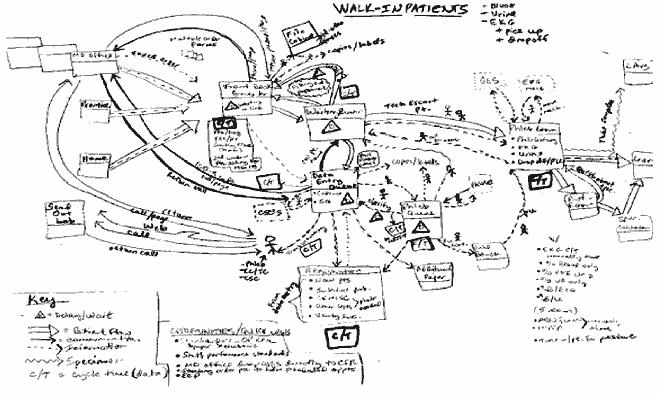
To get back on track in the Measure phase, the team completed a Lean value stream map, replacing the multitude of sticky notes with the flows shown in Figure 1. Even though the map was sketched on EKG paper, it proved to be extremely beneficial and drove the subsequent data collection process. The voice of the customer was included after it was gathered through interviews and surveys with patients and physicians.
A key aspect of any successful project requires verifying the accuracy of the data measurement systems. Originally, time stamps or clocks had been used to track the steps in each patient’s visit, but unfortunately these had not been synchronized, so the data collected was not usable. The measurement system was corrected and then monitored weekly. Manual data collection was required, since the team did not have an electronic tracking system until the Improve phase.
The use of several graphs helped to illustrate the findings:
Histogram – It displayed Monday-Friday patient volume by hour, and showed an increase in patient volume between 9 a.m. and noon.
Run Chart – It displayed staffing by hour per day (Monday-Friday), and showed a decrease in two staff members between 11 a.m. and 2 p.m. because of lunch breaks.
Time Series Plot – It displayed the average patient wait time by hour per day (Monday-Friday), and showed an increase in wait times between 10 a.m. and 2 p.m.
The graphs showed that between 11 a.m. and 2 p.m. the diagnostic testing center was short staffed, yet had the highest volume of patients walking in and the highest wait times of the day.
Developing the following bottleneck analysis helped to uncover process issues and determine the total capacity of each resource per hour:
- Greeter – (Wait time begins.) Reviews patient paperwork, asks any necessary questions, asks patient to complete any forms needed, places patient lab order in a queue for the data entry staff. Total capacity per hour = 48 patients.
- Data Entry Staff – Picks up the next patient order in line, schedules appointment in cadence, orders lab tests in Misys, places patient order and labels in queue for phlebotomist. Total capacity per hour = 46 patients.
- Phlebotomy Staff – Picks up the next patient order in line, reviews order for accuracy of lab requests, calls in patient for procedure. (Wait time ends.) Total capacity per hour = 51 patients.
- Phlebotomy Rooms – Six rooms available for six phlebotomists. Total capacity per hour = 51 patients.
Armed with results of this analysis, the team was able to identify and address the resource with the least capacity – the data entry staff. The Lean value stream map had indicated several rework and review steps in the data entry process which were necessitated when the greeter failed to get needed information. These extra steps were adding several minutes to the overall throughput time, but patients certainly were not seeing any extra value from them.
Introducing Improvements
Perhaps the most obvious improvement to implement was revising lunch and break schedules to allow for maximum staffing levels when the diagnostic testing center was the busiest. Also, during the Improve phase, an electronic wait-time tracking method was put in place and the staff realized several other “quick wins.” One involved specimens routinely brought by patients or office clinicians. Logging in the specimens took valuable staff time away from patients. This issue was addressed by rerouting specimens to the central receiving area of the laboratory.
By implementing electronic call processing, the center was able to reduce the number of incoming calls answered by greeters and data entry staff by about 20 per hour. The hospital also revised the laboratory requisition form, circulating it through mailings and in-services with physician offices, while discouraging the use of scripts. To reinforce the new procedures, all staff attended a half-day customer service training session. The greeter and data entry positions were streamlined to eliminate the extra step of calling the patient back to the desk to gather missing information.
Not all tests were in the computer system, requiring someone to take an order to the copier, and then give a copy to the order entry person. Correcting the tedious and time-consuming tradition of copying orders and hand-writing labels, staff was trained to order certain tests using the computer system. Multiple physician order forms were coming into the center, and sometimes they were incomplete or not filled out properly. New processes were put in place for calling physician offices for patient orders that had no diagnosis or ICD-9 code
The Lean value stream map was revised to reflect streamlined processes for the greeter and data entry staff. With new procedures in place, a patient could walk in, have their order reviewed, questions answered and any forms completed, all while a staff member scheduled the appointment and ordered tests.
The project is now in the Control phase and the team continues to monitor the percentage of patients seen within 20 minutes in relation to volume and staffing. An electronic system lets them track on a real-time basis and make adjustments as needed. The team plans to begin re-surveying patients and physicians to measure satisfaction, and will continue efforts to streamline processes throughout the diagnostic testing center.

Conclusion: Adapting Methods to Get Results
Acquiring a variety of skills, along with experience in knowing what will work best in specific situations, can shorten the path between problems and solutions. The team at Northwestern Memorial Hospital spent five weeks flowcharting and identifying more than 100 tasks, yet the process was still not completely charted. Data collection had stalled; the project was in danger of collapsing. When Lean concepts were introduced, value stream mapping and the Five S’s (sort, straighten, sweep, schedule and sustain) cut through the clutter of confusing information to identify solutions.
Project goals were met. Since improvements were implemented in June 2004, the percentage of patients seen within 20 minutes of arrival has increased from an average of 44 to 84 percent, exceeding the project’s goal of 80 percent. The changes and shorter wait times are definitely having a positive effect on staff and patient satisfaction.
This was a successful project by several measures. The team not only streamlined processes and reduced patient wait time, it also learned valuable lessons about the flexibility of process improvement tools. What started as a typical Six Sigma project evolved to incorporate useful Lean techniques, leading to faster results.