
From January 2012 to September of 2016, there was a minimally formal quality improvement and assessment program (QAPI) within the Mayo Clinic Transplant Center in Phoenix, Arizona. Attempts had been made to grow the program, but success was limited, as assessed by broader metrics of process improvement projects, engagement by the organization, and standardization of metrics, meeting cadence, and outcomes reporting. Improving the structure and formalization of the QAPI program can improve the transplant process effectively and efficiently to enhance the patient experience and improve volumes and outcomes.
Aim Statement
We aimed to create a formalized QAPI program for the Transplant Center with a set of standardized metrics and outcomes reporting, engagement in quality improvement from the organization, and process improvement projects by December 31, 2019.
Define and Measure
The Define, Measure, Analyze, Improve, Control (DMAIC) process improvement methodology was used. In the Define and Measure phases, an overall assessment of the Transplant Center was performed. First, the scope of the program was determined through an assessment of strategic vision, mission and objectives as well as a formal gemba walk of high-level processes. This also helped define customer requirements, which led to gathering baseline data on those requirements.
Vision: Mayo Clinic Transplant Center in Phoenix will be the most trusted partner for health care and be recognized as a premier patient-centered academic transplant center.
Mission: Mayo Clinic Transplant Center in Phoenix will inspire hope and provide the best care to every patient through integrated clinical practice, education and research.
Strategic Objectives:
-
- Increase preference for Mayo Clinic Transplant Center in Arizona among physicians and the public.
- Grow transplant volumes, particularly living donor programs.
- Increase customer satisfaction: patients, referring physicians and third-party payers.
- Enhance financial performance.
- Improve patient access and navigation.
- Enhance patient safety.
- Sustain high quality in each organ program.
- Recruit, train and retain the best staff.
- Develop research and education programs.
- Promote organ donation in the community.
- Develop and mature existing partnerships and collaborations.
The team developed an understanding of key transplant metrics as well as established outcomes reporting, a QAPI meeting schedule and a formal QAPI plan.
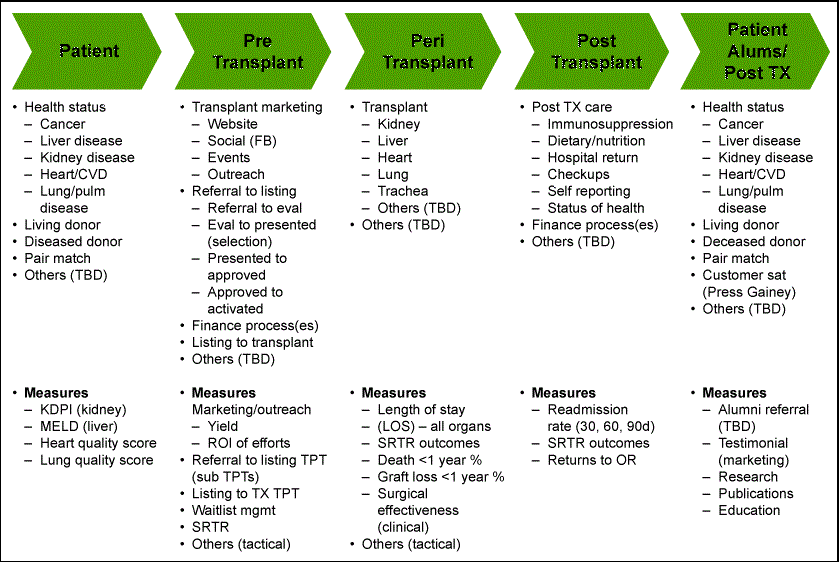
Additionally, an assessment of engagement in quality was made. At the time of this assessment, the key measures for the overall QAPI program were engagement (defined as number of people trained in QI; baseline: 2 persons), QI projects executed (baseline: 1) and standardization of metrics and outcomes reporting (baseline: 0).
Analyze
In the Analyze phase, high-level process maps and root cause analysis were used to identify key factors contributing to the gaps in obtaining and reporting the metrics, meeting cadence, standardization of reporting and presentations, and project generation and documentation of QI activities.
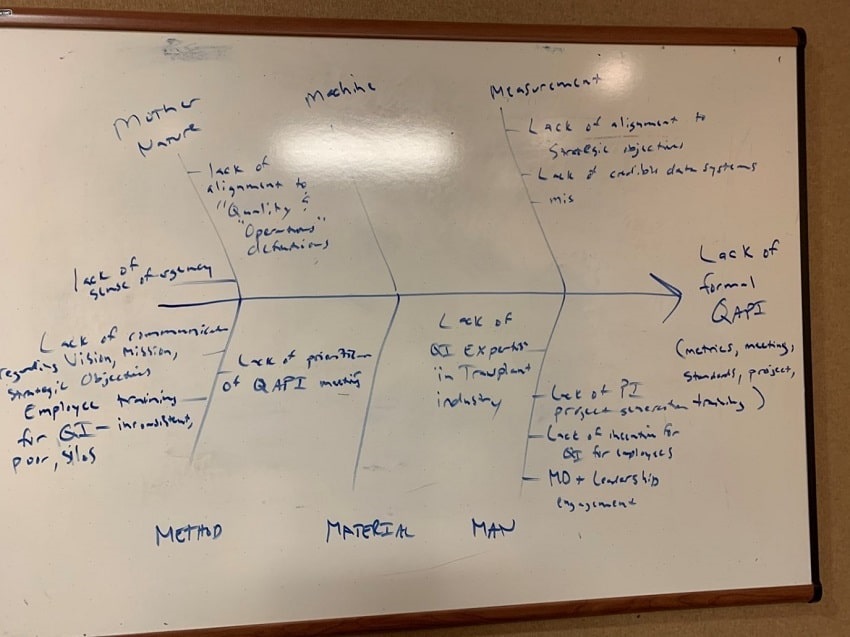
Root causes found included, but were not limited to:
- Lack of sense of urgency for QI
- Physician and leadership engagement
- Lack of communication regarding the vision, mission, strategy and objectives
- Employee training and awareness of QI
- Lack of formalized schedule and prioritization for QAPI meetings
- Lack of prioritization and alignment of strategic objectives and QI
- Lack of accountability on action plans – minor improvements to the practice
- Lack of formal QI project generation and documentation
- Misalignment of operations and quality definitions
- Lack of QI expertise resources within transplant
Improve
In the Improve phase, interventions began to be implemented around standardizing the scheduling of QAPI meetings, the adverse event process, data reporting, data automation, metrics/outcomes needed for presentations, and formalized QI training and project generation. This was created over a phased approach to aid in change management for the organization (see Figure 3).
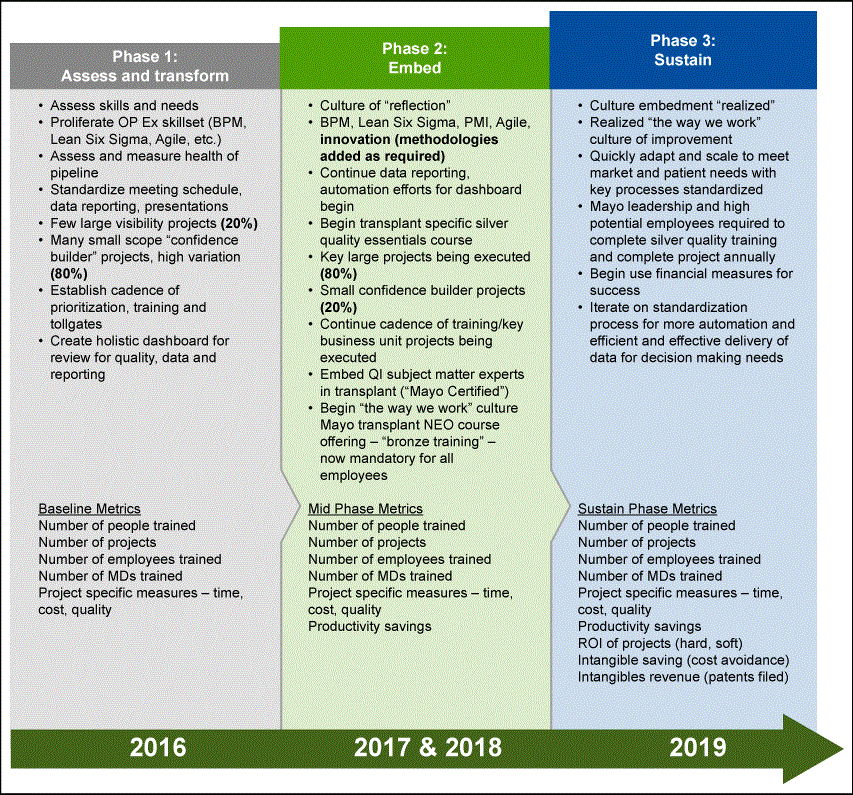
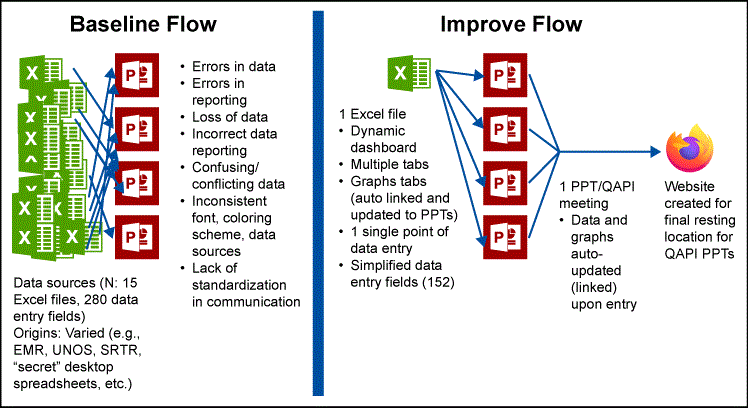
One of the first steps was clarifying the sense of urgency for QI, engagement and communication. QAPI meetings were reinvigorated by leadership, then formalized and standardized in terms of timing. A template presentation for the QAPI meetings as well as a holistic dynamic dashboard were developed from multiple sheets (N=15, 280 entry fields) to simplify the key metrics that were required and needed to understand the practice as a whole. Automation of those key metrics was then incorporated into the presentation packages to aid in efficiency and effectiveness of the use of the data for decision-making as well as a final website using an analytic software called Tableau (see Figures 4 and 5).
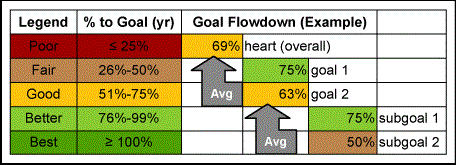
During the phased approach, an 80/20 strategy was deployed for projects, engagement and confidence builders to the organization. Early in the phases, 80 percent of projects would be small in scope with a high variation of metric, while 20 percent would be large in scope with potentially inconsistent or no data available. As the organization progressed in projects, engagement and confidence, this relationship would reverse: 80 percent focus on large-scope projects and 20 percent on small confidence-builder projects.
Training
In addition, a transplant-specific Silver Quality Essentials course (a diluted version of an industry-standard Yellow Belt training) was integrated with a standardized Mayo course from Quality Academy, featuring tailored examples to transplant data, time and resources. This training allowed for not only QI awareness and education but change management to garner the confidence of the organization – both of QI itself and to drive more project generation.
Started as Flow-Based System
Prior to formal training execution, the final aspects of the business review were performed to help scope projects. The Transplant Center lacked a formal prioritization method but the system was largely a queue/flow-based system. Standard Lean and operations management principles can be quickly applied to harvest confidence-builder projects in this type of setting. The team’s first exercise involved using Little’s Law to articulate the flow of the system and where bottlenecks may lie. From there, Six Sigma tools were used to address variation reduction. Both of these methods led to the unique targeted approach for this culture and situation to net the highest benefit.1-5
Transplant = Flow system
- Transplant “factory” physics and math applied
- Little’s Law/theory of constraints – first set of assessment tools
- Six Sigma (defect reduction) – second set of assessment tools
Little’s Law Assessment (First Exercise)
WIP = R * T
Where,
WIP = waitlist patients (avg/year, active)
R = throughput rate (transplants/year)
T = lead time (referral to transplant [TX], avg [year])
In this assessment, WIP and R were known and reported publicly. Standardized definitions for all transplant centers were available and were used as a base start to assess the organization.
For the assessment, T = WIP/R, which would facilitate what the organization should be operating at, defined by the Little’s Law proof.
| Actual Lead Time for Three Organs | |||
| Kidney | Heart | Liver | |
| WIP | 521 days | 38 days | 113 days |
| R | 327 days | 50 days | 127 days |
| T | 1.59 years | 0.76 years | 0.88 years |
Source: SRTR, UNOS, Mayo Clinic EMR
From here, we know what the actual lead time should be for three organs: Kidney = 1.59 years, Heart = 0.76 years and Liver = 0.88 years. At the same time, a new internal tool was being developed (called EDITLIFE) that could give us the current-state lead times as they were happening internally. This current-state assessment gave us:
| Current-State Lead Time for Three Organs | |||
| Kidney | Heart | Liver | |
| WIP | 521 days | 38 days | 113 days |
| R | 327 days | 50 days | 127 days |
| T | 1.75 years | 1.4 years | 1.21 years |
The Kidney, Heart and Liver programs average lead times (referral to transplant) were 638, 511 and 441 days (1.75 years, 1.4 years and 1.21 years, respectively). Notably, the Heart program was operating at two times the lead time that it should be. Knowing that many of the processes have the same set of bottlenecks – such as a holistic meeting of review of patients called “Selection Conference” and a slew of insurance authorizations – now we moved to our Six Sigma and variation reduction tools (second exercise) to precisely target our confidence-builder projects.
The analysis of variance (ANOVA) test showcased that while there was a statistically significant difference between the groups (p-value = 0.0067), the Kidney program had the majority of the variation followed by the Heart program, as shown in the Tukey-Kramer Connecting Letters report.6-8 (See Figure 4.)
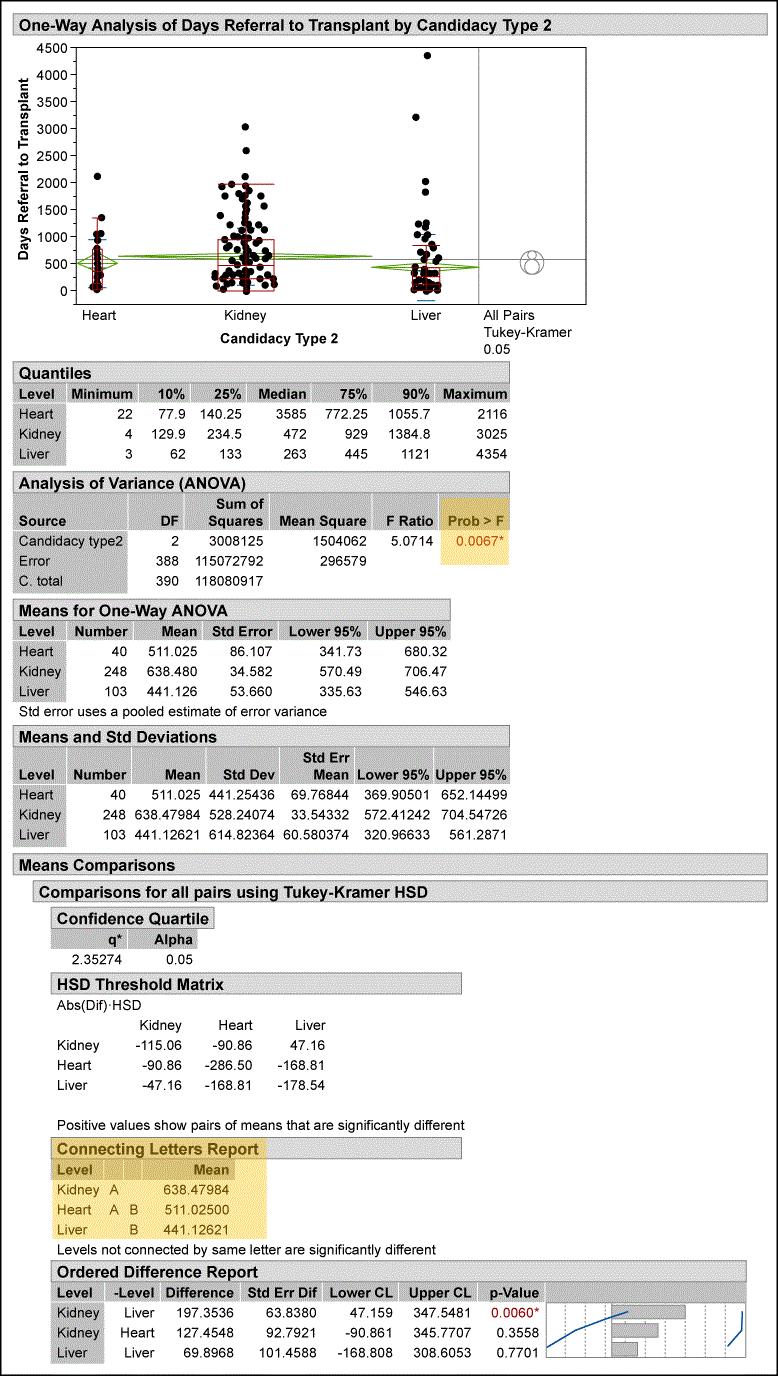
What is critical here is the ANOVA showed us that our biggest win would come from the Kidney program (more samples = 248 kidney transplants vs 40 for heart transplants during the analysis period), not from the Heart program as one might expect. We now knew how to guide the organization into its first set of projects. When the Kidney team members came to training and we asked, “What is your biggest problem in the Kidney Transplant Center?” they replied, “Speed to getting a transplant!” That translated to lead time.
Our first project, thus, was a Kidney transplant “selection to listing” lead time project that lead to massive improvements for the organization. We worked to build the relationship, confidence and rapport with the teams.
Had we not chosen a guaranteed “winner” project to start, in the absence of a formal strategic prioritization of processes like business process management (BPM), our success story may have never occurred.
From September 2016 to the end of December 2018:
- 68 individuals were trained in QI
- 100 QI projects (10 DMAIC, 12 PDSA and 78 action plans) were completed
- A formal standardized dashboard, standardized presentation QAPI package, consistent QAPI Subcommittee meeting schedule and formalized communication foundation for leadership engagement and process flow were enabled
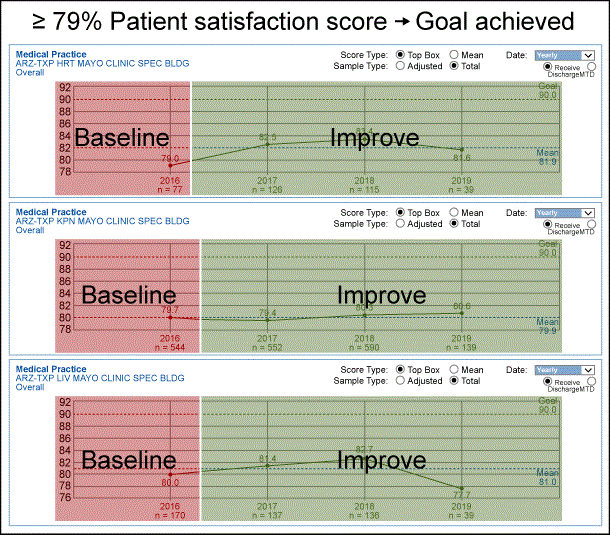
QI engagement (as measured by training) and QI projects and outcomes summary graphs are featured in Figures 7 and 8 and Table 2, respectively. Finally, our counterbalance of patient satisfaction stayed the same, which we consider a success; we were able to move patients faster through our system without adversely affecting their satisfaction (see Figure 9).
In total, the cumulative return on investment (ROI) of this operational excellence deployment model was $28.8M. Of this, $11.2M were from operations cost reduction and efficiency gains (net present value [NPV] method used) and $17.6M were from revenue increase models, attributed to one project (Living Kidney Donor Transplant Improvement) with standard revenue recognition models used for this measure.
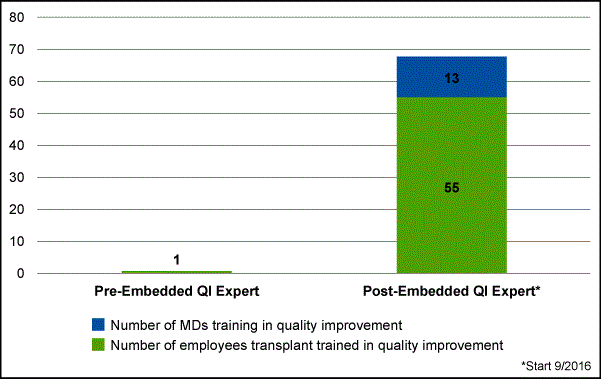
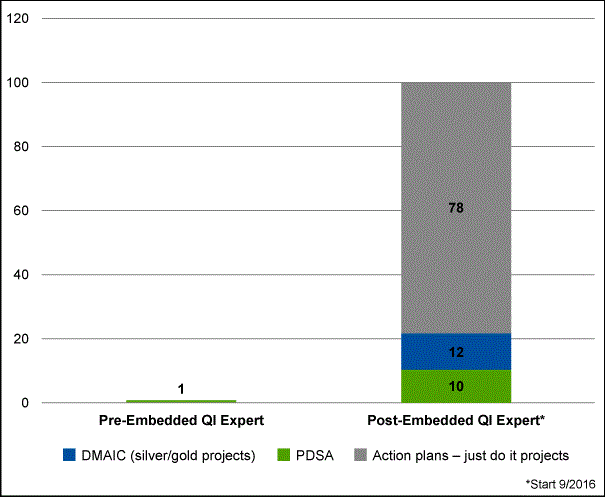
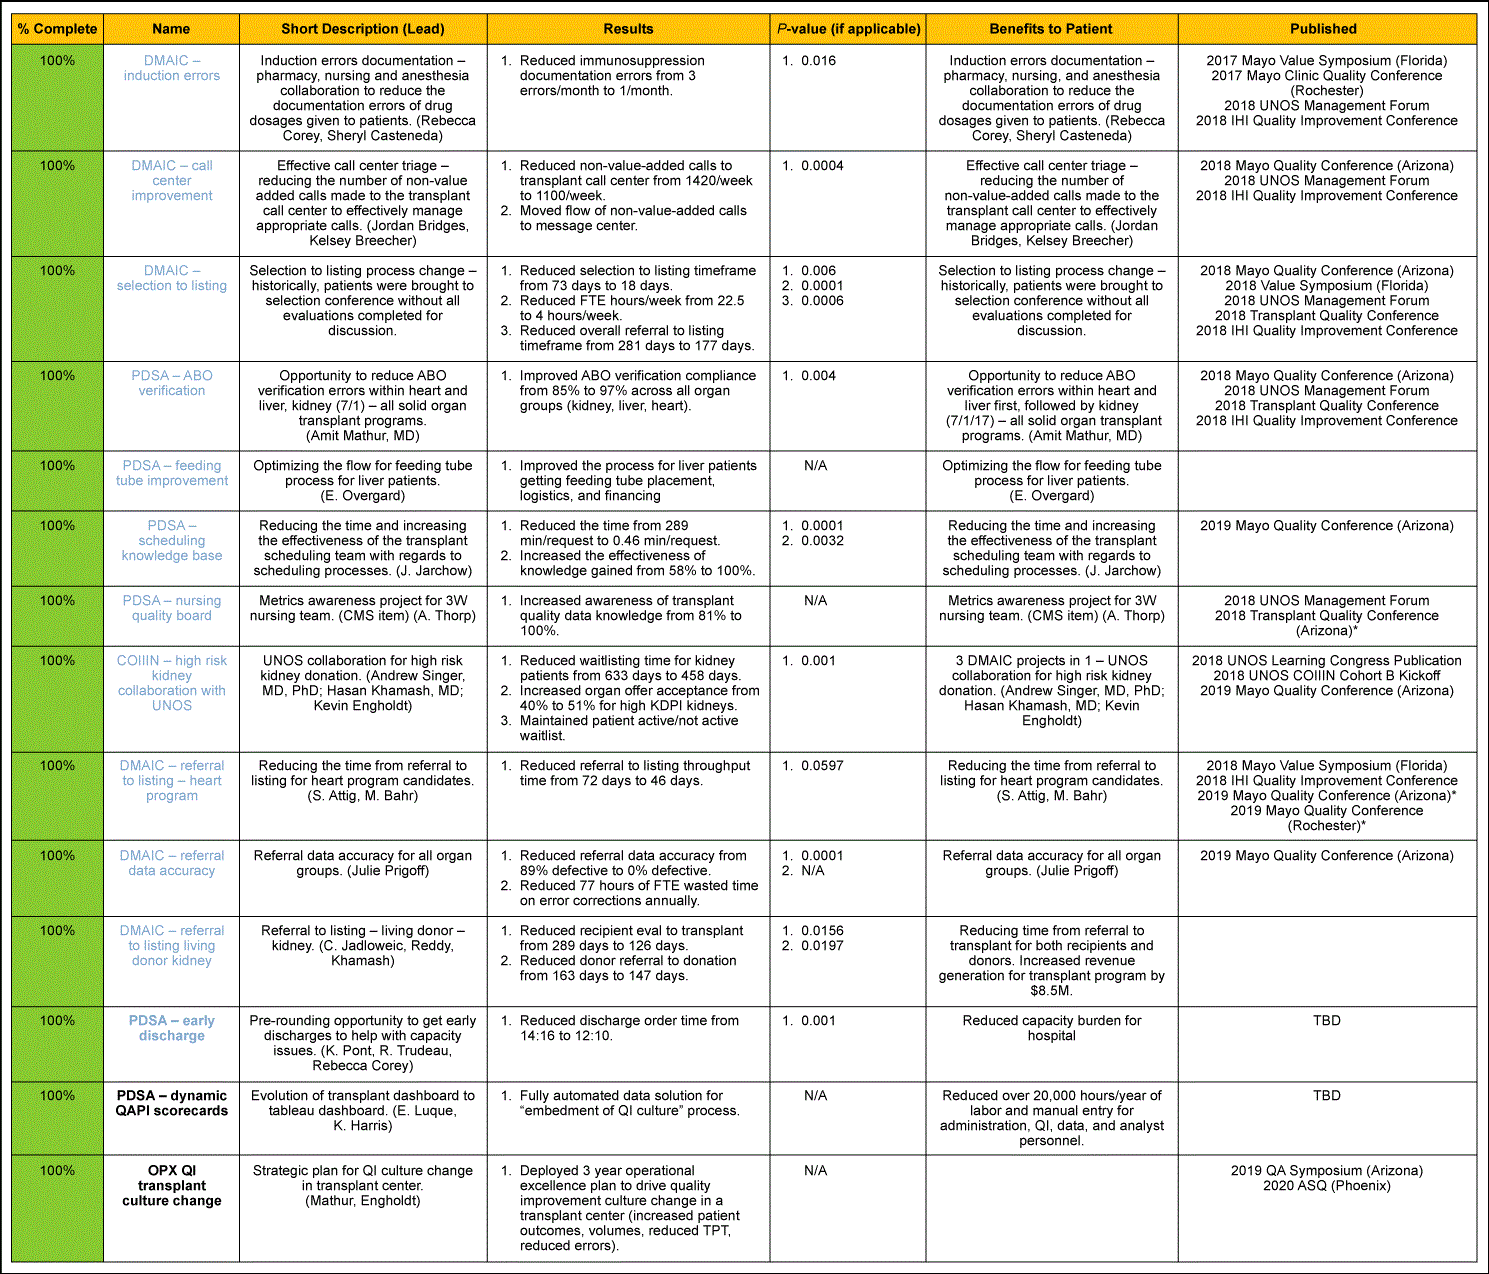 Table 2: Detailed Outcome Summaries (Click to Enlarge)
| Table 3: Simplified Outcome Summaries | |
| Results | Benefits to Patient |
| Reduced immunosuppression documentation errors from 3 errors/month to 1 error/month | Induction errors documentation – pharmacy, nursing and anesthesia collaboration to reduce the documentation errors of drug dosages given to patients |
| · Reduced non-value-added calls to transplant call center from 1,420/week to 1,100/week
· Moved flow of non-value-added calls to message center |
Effective call center triage – reducing the number of non-value-added calls made to the transplant call center to effectively manage appropriate calls |
| · Reduced selection to listing time frame from 73 days to 18 days
· Reduced FTE from 22.5 hours/week to 4 hours/week · Reduced overall referral-to-listing time frame from 281 days to 177 days |
Selection to listing process change – historically, patients were brought to selection conference without all evaluations completed for discussion |
| Improved ABO verification compliance from 85% to 97% across all organs | Opportunity to reduce ABO verification errors with heart and liver, first, followed by kidney – all solid organ transplant programs |
| Improved process for liver patients getting feeding tube placement, logistics and financing | Optimizing the flow for feeding tube process for liver patients |
| · Reduced the time from 289 min/request to .46 min/request
· Increased the effectiveness of knowledge gained from 58% to 100% |
Reducing the time and increasing the effectiveness of the transplant scheduling team with regards to scheduling processes |
| Increased awareness on transplant quality data knowledge from 81% to 100% | Metrics awareness project for 3W nursing team (CMS item) |
| · Reduced waitlist time for kidney patients from 633 days to 458 days
· Increased organ offer acceptance from 40% to 51% for high KDPI kidneys · Maintained patient active/not active waitlist |
3 DMAIC projects in 1 – UNOS collaboration for high-risk kidney donation |
| Reduced referral-to-listing throughput time from 72 days to 46 days | Reducing the time from referral to listing for heart program candidates |
| · Reduced referral data accuracy rate from 89% defective to 0% defective
· Reduced 77 hours of FTE wasted time on error connections annually |
Referral data accuracy for all organ groups |
| · Reduced recipient evaluation to transplant from 289 days to 126 days
· Reduced donor referral to donation from 163 days to 147 days |
Reducing time from referral to transplant for both recipients and donors |
Discussion
This case study is a recipe for how an embedded QI expert can enhance a multidisciplinary team for the betterment of patients. While the results are impressive, we recognize that not every healthcare practice can model, afford or accomplish the same results. Our leadership engagement was critical to the success of the foundation of the program and the risk of hiring an outside QI expert. There are opportunities for more research and insights that can be leveraged to learn more on this work. We propose a few here:
- QI vs. outcomes research – impact of QI on outcomes (e.g., readmissions, length of stay, etc.)
- Outside healthcare experience QI expert vs. internal QI expert
- ROI of a QI expert
- Shared model of QI for smaller practices (e.g., 50/50 or 25/25/25/25 share models)
This model has been used to teach medical students as a QI elective to help transform the future of how QI is led, from the beginning of medical school.
Key Learnings
Pros
- Data: Data is largely defined for the hospitals by government entities (e.g., Centers for Medicaid Services or CMS). All 6,000+ hospitals in the U.S. have the same definitions for length of stay, readmissions and other standard metrics because they have to be reported publicly. This is a massive assist in terms of data as operational excellence deployments should not need to do heavy measurement systems analysis (MSA) for some of the most basic processes in the hospital system. Skipping this arduous DMAIC step permits a fast way to solve problems and quickly allows for benchmarking across competition using these reliable and credible definitions across the industry.9
- Problems: Problems that appear to be small in nature have large cascading effects throughout the hospital systems – making small ripples can cause large chain reactions and repeatability for projects in different areas very easy. With problems being relatively easy to solve, confidence can be won from any organization fairly quickly and this confidence can positively influence culture change.
- Impact: When solving problems in healthcare, the impact on human life can be far more dramatic than an ROI to a business. Operational excellence can optimize hospital systems with the end goal of giving more healthcare to the population in a more effective and efficient way. This not only saves more lives, but saves costs long term, increases outcomes, reduces healthcare burden on U.S. economy and increases patient satisfaction. An example of this is within the Heart Transplant Referral to Listing process. Most of the time when someone needs a heart transplant, it’s due to heart disease, congestive heart failure or other environment factors (driven by the person’s diet, lifestyle, etc.). But in the rare cases where someone is born with a heart defect (congenital), they will likely die without a heart transplant. We were able to speed up the process to get patients a heart transplant from 72 days to 46 days. While the ROI was a paltry $67,000, the impact was large. A doctor stated, “I usually see these congenital heart defect people once, as they usually die by the time we can get them through the process. What is amazing is I’m more confident now, more than ever, to get them transplants as we have saved them a month of time to get here and get transplanted. It’s incredible.” While operational excellence is largely tied to ROI, the impact in the healthcare space is truly powerful as you can affect an entire population’s health.
Cons
- Hierarchy: The healthcare industry is deeply hierarchal. An industry that is physician led and a culture of “all will serve the physician’s needs” or “serve thy physician” can be a difficult environment in which to drive an operational excellence program, which at its core is “all employee empowerment.” There is some evidence suggesting physician-led organizations lead to higher outcomes, but it is not entirely clear. The research shown “does not establish that physicians make more effective leaders when compared with professional managers; but it starts the empirical process. It finds that hospitals positioned higher in the S. News and World Report’s ‘Best Hospitals’ ranking are led disproportionately by physicians.” Correlation, more often than not, doesn’t prove cause – there may be a behavior element such as peer-respect and peer-rapport when taking orders. Physicians don’t like to take direction from non-physicians.10 Moreover, healthcare conferences, such as the Institute for Healthcare Improvement, have conference bookstores that are almost entirely dedicated to books on “engaging the physician” – strategies to dance around the topic of hierarchy of the physician and getting them to lead more collaboratively than authoritarian style. This can get even more difficult in contract hospital settings where almost all healthcare services are contracted out and no alignment from groups exists – making the hierarchy the baseline for communication. Interestingly, there is minimal research showing employee satisfaction in physician-led versus non-physician-led organizations – an opportunity to see the other side of the story. A culture where entire teams collaborate to solve problems and have success is then relegated to not getting their names on the authorship of the paper as they aren’t physicians (whether the physicians made it to the meetings or not), not able to go to conferences and are told to “not sit at the center conference table when presenting the project.” Again, because they aren’t the physician, non-physicians can be counterproductive to “inspiring all” versus “serving the MDs.”11,12
- Innovation: The healthcare industry is a classic example of trying to solve problems like “changing a tire on a train moving at full speed.” Slowing down to speed up for the long term is a not a reality in the industry – no one has time, interest or formal operational excellence or innovation training. This then cascades to a slow innovation cycle for the industry as a whole, making it one of the slowest to adopt change. An example of this is the fact that 80 percent of hospitals still use pagers to communicate. The pager has been archived in technology museums as it was a technology of the 1980s, 40 years ago.13 Moreover, disruptive change can be viewed as not following the rules, something that is not welcome in a culture that emphasizes respect for authority, compounding the lack of incentive to improve processes.
- Incentives and talent recruitment: In the for-profit sector, individuals are managed by objectives. Meeting objectives leads to raises and bonuses. Operating margins for hospitals are 1.9 percent to 5.1 percent for the majority of hospital systems.14 There is very little room to incentivize operational excellence improvements, financially. There are, however, publications. Publications in the academic world are like bonuses in the for-profit world. Individuals who are able to publish create a robust CV. If the organization is deeply hierarchal, however, we’re back to the first con – the only individuals who will be able to publish and be recognized are the physicians, who make up less than 20 percent of the workforce in the hospital systems, reducing overall interest in solving problems for the organization.15 In addition, hiring professionals that are able to deploy operational excellence programs are typically paid more in for-profit settings. A typical Lean Six Sigma Master Black Belt’s median salary is $154,000 and experienced practitioners can garner $200,000–$250,000 total compensation at top tier for-profit companies while some of the most senior hospital administrators’ median salaries are $54,000 and many are capped out at $150,000.16 This gap in pay for talent makes it difficult for professionals with experience to dip into the healthcare sector as they would be taking a large pay cut for a career in healthcare. The ultimate effect is to limit the talent pool for one of the most critical industries.
- Industry dysfunction: Embarrassingly, for an industry of brilliant persons, the U.S. healthcare system is clearly the most dysfunctional. It has been the subject of attempted reform by the government a total of 12 times in the past 100 years – more than any other industry, ever.17 Supply-chain silos of pharmaceutical manufacturing, insurance coverages, government vs. nongovernment payers, contract method hospitals vs. destination hospitals, profit vs. nonprofit objectives (within the same industry and between industries [e.g., for-profit insurance company is incentivized very differently than a nonprofit hospital]), patient expectations and the physician culture of demanding respect, and a slew of long tail idiosyncrasies, make for a difficult industry to influence and change. The supply-chain silos have influences across political tables to push their agendas – effectively paralyzing the healthcare process across the entire system. Moreover, patients in the early 1900s didn’t have access to information about their medical care. In the age of the internet, patients with a diagnosis are able to educate themselves as much as they can (from the public library of medicine [Pubmed.org]) to learn about self-care and ask educated questions to the physician team. When “Dr. Google” comes up in a care appointment, the physician team largely roll their eyes and state a derivative message of “Well I went to medical school, just obey.” This leaves the patient in a state of frustration from not being heard, leading them to seek alternative care or insight – in effect, removing the voice of the customer entirely from the opportunity to improve care. The customer could be a patient with a terminal diagnosis like cancer. There is no stronger sense of urgency to learn aggressively and solve a problem than when death is the outcome. Removing a highly incentivized voice of the customer in this situation further compounds the dysfunction of an industry, leaving the customer feeling powerless. While the physician is right – they have studied an enormous amount of anatomy and physiology – if the patient has only one disease to learn, motivated by the fear of death, they can spend months reading about it and potentially know more than the physician who had to memorize thousands of disease states and couldn’t possibly know everything about everything. This then makes the patient more effective and targeted to understanding their disease, but not capable of communicating to the physician as the culture of healthcare does not allow the patient to have a true feedback mechanism with the physician as they are only allowed to obey and not question. There have been intriguing root causes that can create cascading effects to the industry as a whole. For instance, pricing of healthcare services is largely considered a trade secret. In October 2020, however, the U.S. Departments of Health and Human Services, Treasury, and Labor issued a final rule regarding price transparency requirements on health plans and insurers. The rule is meant to help increase market competition by allowing patients to estimate their cost-sharing before receiving healthcare. Patients’ ability to shop around could force innovation and optimization in an industry largely paralyzed for the above reasons.
Closing Comments
The healthcare industry has probably one of the biggest roles in our economy and is a green field for operational excellence opportunities. With a cost burden of 17.8 percent of our gross domestic product (GDP) versus the 9.6 percent of similar countries of economic status, this is one of the most critical industries to optimize.18
This case study has been considered a success but was not without its challenges. The healthcare industry is a great place for Lean, Six Sigma and quality-related efforts but has the same struggles as the for-profit industry with added industry culture and hierarchy barriers. Remember, the government has attempted to reform the U.S. healthcare industry a total of 12 times in the past 100 years. It may need more than government reforms to optimize and change its culture – it may need a cultural revolution or a global pandemic like COVID-19 to expose the gaps and highlight the opportunities to let go of the old culture and craft a new one.19,20The healthcare industry has a bright future ahead for operational excellence efforts and case studies like this will hopefully become the norm to guide others, rather than the outlier.
References
1. Little, J. D. C. (1961) “A Proof of the Queuing Formula: L=AW,” Operations Research, 9, (3) 383-387.
2. Little, J. D. C. (1992) “Are there ‘Laws’ of Manufacturing,” Manufacturing Systems: Foundations of World-Class Practice, edited by 1. A. Heim and W. D. Compton, National Academy Press, Washington, D.C., 180-188.
3. Wolff, R. W. (1989) Stochastic Modeling and the Theory of Queues, Prentice-Hall, Inc., Englewood Cliffs, New Jersey.
4. Stidham, S., Jr. (2002) “Analysis, Design, and Control of Queueing Systems,” Operations Research, 50, (1) 197-216.
5. Harry, M and R. Schroeder. Six Sigma – The Breakthrough Management Strategy Revolutionizing the World’s Top Corporations. 2006. Random House Publishing.
6. Harry, M. et. Al. Practitioner’s Guide to Statistics and Lean Six Sigma for Process Improvements. 2010. Wiley and Sons.
7. Montgomery, D., Runger, G. Applied Statistics and Probability for Engineers. 3rd Edition. 2003. Wiley and Sons.
8. D. Montgomery. Design and Analysis of Experiments. 7th Edition. 2009. Wiley and Sons.
9. Medicare.gov. “Hospital Compare.” Data repository for all hospitals receiving Medicaid monies. (https://www.medicare.gov/hospitalcompare/About/What-Is-HOS.html). Date accessed May 15, 2020.
10. Goodall, A. “Physician-leaders and hospital performance: Is there an association?” Social Science and Medicine. 73 (2011) 535-539.
11. Crowe, S. “ ‘You do not cross them’: Hierarchy and emotion in doctors’ narratives of power relations in specialist training.” Social Science and Medicine. Aug, 2017. Vol: 186, Pgs 70-77. https://www.sciencedirect.com/science/article/pii/S0277953617303507
12. Conrad, P., Carr, P., Knight, S., Renfrew, M.R., Dunn, M.B., and Pololi, L. (2010). Hierarchy as a Barrier to Advancement for Women in Academic Medicine. Journal of Women’s Health. 19(4): 799-805.
13. History of Technology, Intel Corporation Museum. Smithsonian Heritage Museum Series. (https://www.intel.com/content/www/us/en/history/museum-visiting-intel.html). Date accessed May 5, 2020.
14. Holloran, Kevin. Smaller U.S. Non for Profit Hospitals Lead a Turnaround in Margins. Fitch Ratings. September 3, 2019. (https://www.fitchratings.com/research/us-public-finance/smaller-us-nfp-hospitals-lead-turnaround-in-margins-03-09-2019). Date accessed May 15, 2020.
15. U.S. Department of Health and Human Services. Physician Supply and Demand to 2020. October 2006. (https://bhw.hrsa.gov/sites/default/files/bhw/nchwa/projections/physician2020projections.pdf). Date accessed May 15, 2020.
16. Salary.com Research Database. Search terms used, “Hospital Administrator” and “Six Sigma Master Black Belt.” (https://www.salary.com/research/salary/). Date accessed May 15, 2020.
17. Taylor, Jerry. A brief history on the road to healthcare reform: from Truman to Obama. Becker’s Hospital Review. May 2017. (https://www.beckershospitalreview.com/news-analysis/a-brief-history-on-the-road-to-healthcare-reform-from-truman-to-obama.html). Date accessed May 15, 2020.
18. Bauchner, H. Healthcare spending in the United States compared with 10 other high-income countries. Journal of American Medical Association. March 13, 2018, Vol: 319, No: 10
19. Emanuel, E. Will 2020 be the year that Medicine was saved? New York Times. April 14, 2020. (https://www.nytimes.com/2020/04/14/opinion/coronavirus-hospitals.html). Date accessed May 15, 2020.
20. Armour, Stephanie. Trump administration price-transparency rule covering hospitals upheld. Wall Street Journal. June 23, 2020 (https://www.wsj.com/articles/trump-administration-price-transparency-rule-covering-hospitals-upheld-11592945973). Date accessed September 16, 2020.