Located in Lafayette, Louisiana, Our Lady of Lourdes Regional Medical Center recently began working with GE Medical Systems to implement Six Sigma as a method for achieving quality and process improvement. Since patient throughput and bed availability are among the organization’s top concerns, the team began by focusing on this issue. Following a process of selection and scoping, they launched a Six Sigma project to reduce the time between when a discharge order is written for a patient and when that hospital bed becomes available again.
Defining The Problem
During the Define phase, a 15-member cross-functional team from Lourdes participated in several interviews with GE’s team to outline the current ‘discharge to bed available’ process and determine the most important factors, otherwise known as CTQs or “critical to quality” elements. A project charter was created to identify which aspects would be in and out of scope, and the current process was mapped. For every Six Sigma project, the ‘opportunity’ and ‘defect’ must be defined before the Measure phase can begin. For this project, an opportunity was the time from a written discharge order to the time the bed is available for the next patient. A defect is any opportunity exceeding the upper specification limit or maximum allowable time to complete that process. The team developed a project timeline and had the phase approved by the project’s executive sponsor. Having the CEO as the sponsor demonstrated the commitment and support on behalf of the organization.
Moving Into the Measure Phase
The ‘Discharge to Bed Available’ process was broken down into logical sub-processes:
- Doctor writes discharge order until patient leaves room
- Patient leaves room until housekeeping notified
- Housekeeping notified until housekeeping starts cleaning
- Housekeeping starts cleaning until housekeeping finishes cleaning
A time and motion study was used to measure each step in the process to determine factors impacting the overall process. The physicians do not record the time when issuing discharge orders, so the team used manual data collection to gather this information. Data for the remaining process steps was available from electronic systems within the hospital.
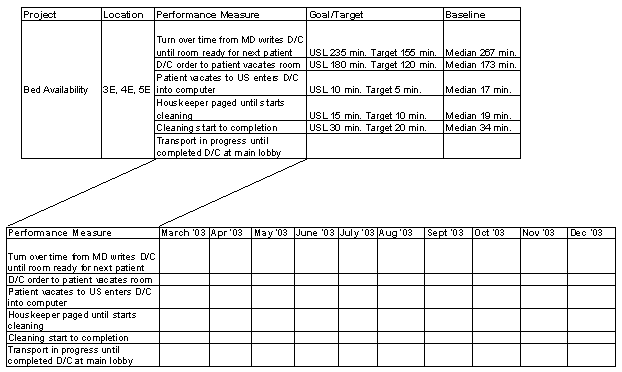
Three nursing units, including both day and evening shifts and representing approximately 1/3 of the total beds, were measured and used as a statistically significant sample for the entire hospital. Time targets and upper specification limits were set for each of the four sub-processes based on the experience of the project team and the expectation from the customers (see Figure 1).

After collecting the data, the team used Minitab software to create process capability reports for the entire process and four sub-processes. The reports indicated that 60 percent of the opportunities were defects, or in other words, the ‘discharge to bed available’ process took longer than the upper spec limit (set at 235 minutes) 60 percent of the time.
The team then created a summary of key findings with several reasons for the process taking longer than desired and for the variability within the process. This information was refined to focus on key opportunities for improvement. Lastly, the team produced a communication (physician and staff newsletters, staff meetings, bulletin boards) and work plan (who, what and when) for the process improvements. To build acceptance, it’s important to communicate and create awareness internally.
Analyzing the Data
Every outcome can be thought of in the form of a function, Y= f (X). The Y, or goal, of this project was an available bed. Big X‘s are all of the major factors that influence the Y, whether a bed is available or not. Little x’s are subfactors that influence a big X.
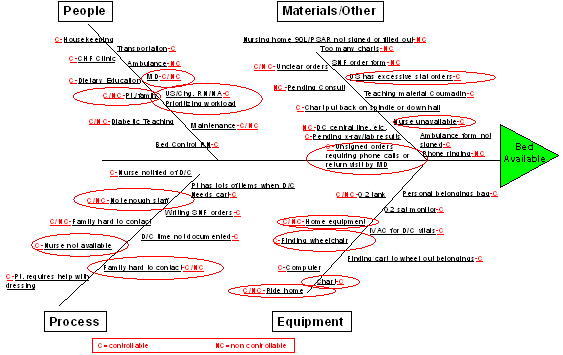
A fishbone diagram (below) helped to visually map the drivers of variability in the process. After deciding which drivers were controllable versus uncontrollable, the team created another payoff matrix to chart each driver of variability on an ‘Effort to Fix’ vs. ‘Benefit from Fixing’ axis. The team again measured all the steps and correlated this with the overall length of the process, determining which drivers had the greatest impact. This helped to prioritize which root cause would be corrected first.

The change acceleration process (CAP) was used to ensure organizational acceptance for project success. A thorough Stakeholder Analysis, which is one of the CAP tools, was conducted to ensure that the targeted processes would be effectively changed. Specific strategies were formulated for each stakeholder group to ensure the group was prepared for and supportive of changes to the current processes. This exercise is an important part of creating a culture that will be receptive to change during a Six Sigma project. Below is part of the stakeholder analysis.
|
|||||||||||||||||||
Putting Improvements in Place
During the Improve phase, with root causes uncovered and prioritized, actions were taken to improve the time from discharge until the patient left the room, including:
- A priority for ‘pending discharge’ was added on the computer that listed patients needing an X-ray, lab work, or supplies/equipment at home. This ensured that a patient needing any of the above before discharge became a priority, therefore reducing the time the patient needed to remain in the room.
- The staff was re-educated on the purpose and use of the bed tracking system. Once the patient was ready to leave their room the staff member would dial in and communicate the room was being vacated. This ensured that Bed Control was aware and could process the bed for the next patient.
- A question was added to the core data sheet, “How will you get home at discharge?” so that transportation issues could be handled at the time of admission rather than waiting for the patient to be discharged to start coordinating transportation.
- A patient discharge video was developed and placed on the patient TV channel. Patients and family members are encouraged to watch so that discharge expectations are communicated early in their hospital stay.
- Since nursing home patients often lengthened the total time of the process, physicians are being asked to begin annotating Form 90L twenty-four hours prior to discharge for existing nursing home patients to ensure an efficient process.
Overall, the time from discharge order to bed available was reduced from 267 to 235 minutes, a 12 percent decrease! The median, rather than the mean, of the data was used because the data is non-normal, having a P-value of less than 0.05. The housekeeping portion of the process increased from baseline. Some key members of the team are meeting to address these causal X‘s, aiming to reduce the time for that subprocess.
The variability of the process also improved. The standard deviation went from 318 minutes to 168 minutes. The potential one-year economic impact of the improved process for just the three nursing units improved by this project is approximately $66,000. If the housekeeping portion of the process returns to at least baseline time, there will be an overall impact of an additional $79,000. If this process improvement were instituted enterprise-wide, the impact would be $198,000 annually (without housekeeping’s improvement).
Gaining Control
Process improvements only work if they lead to long-term changes in behavior and performance. The ‘dashboard’ shown below was implemented to track results and ensure the improved process remains improved over the long haul. Leadership uses the dashboard to monitor progress and take appropriate steps in a timely manner. The hospital celebrated the successful completion of the project, and a storyboard showed the staff the steps in the process and the overall success to date. Recognizing and celebrating success encourages a culture of change and helps to ensure a lasting impact.

Conclusion
Not only has this project reduced the total time of the ‘discharge to bed available process,’ it has also served as a force for cultural change within the hospital. Leadership support and active participation from employees were key factors in successful project completion. The team at Our Lady of Lourdes expressed enthusiasm for the results and felt empowered to implement positive changes within their organization.
Lourdes has seen the results of Six Sigma and has embraced this methodology as their quality program moves forward. They are currently in the process of having 18 staff trained as Six Sigma Green Belts and Black Belts, and are developing a list of subsequent projects. Current areas of interest include: people productivity, charging on charting, physician utilization of computer and best practice guidelines for congestive heart failure and pneumonia.