
One of the participants in our Six Sigma Black Belt training program expressed concern about a lack of buy-in for Six Sigma in her organization. With little inquiry into the matter, we discovered that the means she adopted to gain buy-in were not apt for selling the philosophy.
A lack of buy-in is most common in organizations that are new to Six Sigma. How can practitioners sell Six Sigma? It is simple – by setting up a demonstration case. This approach emphasizes the “seeing is believing” mode of selling. We encouraged this participant to request some time from her senior management and various process owners, in order to uncover the organization’s pain points and to illustrate how Six Sigma could help with these problem areas.
Defining the Problem
The Black Belt’s first discussion was with the business leaders of the organization to identify and enlist some recurring pain areas that could be resolved using Six Sigma. The second discussion was with the concerned process owners and other key personnel. In this conversation, the Belt was trying to determine if the process owners perceived the pain points the same way that the business leaders did, and if yes, what might be the best metrics to measure successful improvement in those areas.
Once these two rounds of discussions were over, the Black Belt started work on a project charter for one of the problems uncovered in the meetings with the business leaders and process owners. Two of the key elements that go into a project charter, a main component of Define, are 1) the business case and 2) a goal statement.
In this situation, the Belt included the following information in the project charter:
- Business case – A significant proportion of the healthcare charts processed are not meeting the prescribed turnaround time (TAT) target. In order to retain the customer, the organization needs to improve its service delivery performance to them by ensuring that 100 percent of the charts meet the TAT target.
- Goal statement – Increase the percentage of charts meeting TAT target from an existing 5 percent and below to 100 percent by month X.
On completion of the charter, the Belt shared it with the business leaders and process owners in a structured and simple to understand presentation. From there, the Belt continued on the DMAIC roadmap to demonstrate how Six Sigma could help complete the goal statement.
Measuring the Current Process
Because the project focused on time-related metrics, the Measure phase predominantly involved Lean concepts, such as takt time, which is used to understand the customer demand rate, and an operational time study and line balancing, used to check the balance of the existing line (the sequence of operations that are responsible for completing one unit).
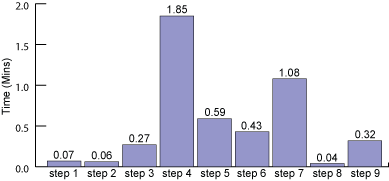
With the assistance of some of the team members nominated for this project, the Belt followed a batch of 50 downloaded charts subject to conversion and subsequent upload, and proceeded to grasp an understanding of:
- The steps involved in the chart conversion process
- The time it takes to complete these steps (Figure 1)
To accurately measure the percentage of charts meeting the TAT target, the team created a measurement system to capture data on a daily basis for every chart that is downloaded (Table 1).
| Table 1: System for Tracking Chart TAT | ||||||
| Batch No. | No. of Charts Received | Chart No. | FTP Download Date and Time | Current Status (Uploaded or Pending) | Upload Date and Time | TAT |
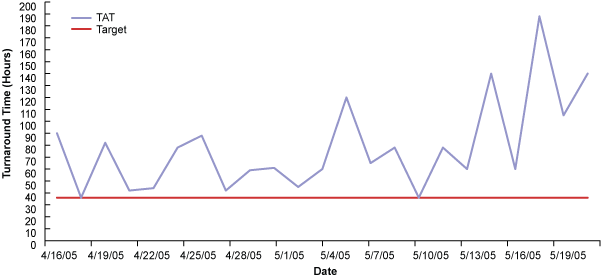
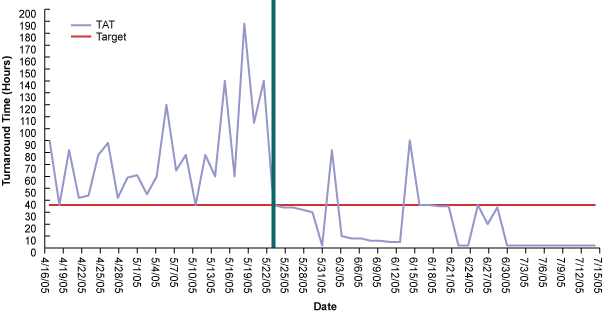
The team also set up a run chart to monitor performance (Figure 2). The red line indicates the 36-hour TAT target, while the blue line indicates the current state of TAT. If all is well, the blue colored line should run comfortably below the red line.
Analyzing the Demand and Capacity
1. What is the customer demand?
In other words, how many documents need to be turned around in what time? The Belt in this case analyzed one month of data to answer this question (Figure 3).
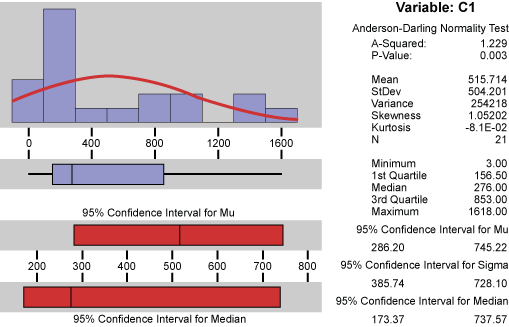
The process had received an average daily load of more than 516 charts, with a large amount of variation between the loads received every day. However, the third quartile was 853, meaning that at least 75 percent of the days the process received loads equal to or less than 853.
2. What is the capacity available with the process?
In other words, how many charts can be turned around in specified time? The process originally operated in three shifts. The team was a little apprehensive about basing the as-is time on one study done in the Measure phase, and hence dedicded to carry out a second time study to ascertain the time consumed per chart.
The results:
- First batch – time per chart = 4.806 minutes
- Second batch – time per chart = 4.6 minutes
These were not significantly different. The team based further analysis of capacity on a 4.806 minutes per chart rate (a pessimistic figure). In some cases of establishing elemental time study, several rounds of data collection may be involved. In some trials, practitioners may discover amazing figures. Beware, however, as they might be too optimistic to repeat again in reality.
Based on the answers to the two questions, the team could determine the following:
Data on Chart Processing
Average processing time per chart = 4.806 minutes
Shifts operating per day = 3 (Third shift reserved for overtime work, not included in capacity calculations)
Staff available = 24 (10 in each of the first two shifts, 4 in the final shift)
Shift 1 = 10 staff x 7 hours x 60 minutes per hour = 4,200 minutes
Shift 2 = 10 staff x 7 hours x 60 minutes per hour = 4,200 minutes
Total per day = 8,400 minutes
Available capacity: 8,400 minutes/4.806 minutes per chart = 1,748 charts per day at 100 percent efficiency
Customer demand: Average for March ’05 = 515 charts/day; Peak load observed on any given day = 1,618 charts
From this analysis, it seems likely that the staff could achieve the TAT target for incoming volumes well within two shifts.
Next, the team determined the takt time for the process, using the formula:
Net operating time per period / Customer requirement per period
In this case, the net operating per period = 14 hours x 60 minutes per hour = 840 minutes. Customer requirement per period = 850 charts per day (Taken from the third quartile value of the one-month analysis)
Takt time = 840/850 = 0.988 minutes per chart, or 59.3 seconds per chart.
Therefore, the ideal pace of each operation should be set at about 59.3 seconds. If this ceases to happen, it indicates there is a lack of flow in the process. A lack of flow is an indicator of problems in the line, which can either be imbalances, breakdowns or any other pertinent reasons.
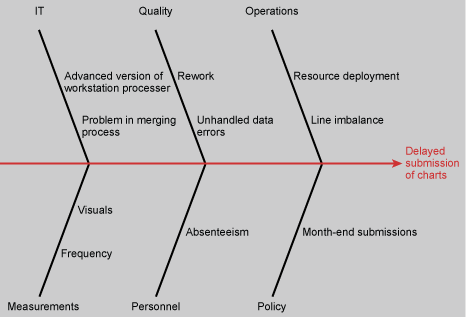
The team began monitoring hourly output at the submission stage of the process. Every hour, 60 charts (at 59 seconds per chart) should be submitted to meet the average load. Because they knew the demand, the capacity available at 100 percent and the as-is time for the process, they could redesign the process to meet X load from the customer. The team decided to design the line for 700 charts (an arbitrary figure) to begin with. With 75 percent efficiency (an achievable standard in the industry) the process should achieve 700 charts in seven hours. The team ran this line for some time and discovered a number of causes that hampered achieving the target loads within the target time (Figure 4).
Improving the Process
With the discoveries made in Measure and Analyze phase, the team brainstormed and arrived at the following steps to follow on a daily basis to improve the process:
- On receipt of the charts, segregate into Clean and Coding categories. Clean charts should fall first in the queue.
- Quantify the volume of work to be executed for the day on receipt of the charts. All the charts are downloaded around 6:30 a.m.
- Deploy people as per the time study data gathered in Measure.
- Estimate the completion time based on takt time and time study data obtained earlier. Operations team should monitor the upload on hourly basis rather than looking at the outcome after 36 hours (the target).
- Monitor online for any bottlenecks and resolve if they appear.
- By the end of the day review the delays and brainstorm the causes for them.
- Develop required countermeasures and make an implementation plan.
Performance reviews should take place at the end of every day (Table 2).
| Table 2: Daily Performance Review | |||
| Date | Average TAT (Hrs) | Causes | Countermeasures |
| 6/27/05 | 33.08 | Posting delay on 6/27 and server down on 6/28 | |
| 6/28/05 | 15.06 | Posting delay, delay in download due to server problem, delay due to wait time in queue | |
| 6/29/05 | 25.22 | Absenteeism (3 out of 10 people absent), merging software down | |
After several such runs data was collected to see if the performance had changed (Figure 5). The graph showed significant improvement in performance.
Controlling the Results
An early indication that a process is losing control on its performance is when practitioners begin to miss measuring it on a predetermined basis. Missing to measure the performance on an agreed upon basis leads to late knowledge of the damage, which means it is too late to fix the damage. The team agreed to continue monitoring the process and brainstormed operational procedures to carry on after the project closed, including:
- All staff are to arrive by 7:30 a.m. for the first shift and 3:30 p.m. for the second shift.
- All staff are to stop and start work at the same time during breaks.
- Downloading charts is to start at 7:00 a.m.
- Operators must take a count of the total number of charts to be processed for the day (work-in-progress and fresh charts).
- Operators must monitor the number of charts getting processed every hour and attack deviations as soon as they occur.
- Managers must re-allocate resources and balance the line as required.
- Operators should summarize the number of charts received and average TAT on a daily basis.
The senior management and the operations team were held equally responsible for sustaining the results of the project. A dashboard was set up so that management could view the performance of the process and keep up to date with it.
Based on this demonstration of Six Sigma success, the Black Belt was able to gain buy-in for the method from the organization’s senior leaders and the process owners.