A 250-bed hospital had implemented total quality management (TQM) to improve customer delight in its diagnostic clinics. After that success, the management team of the hospital was ready to proceed with further process improvement. After completing a brainstorming and prioritization exercise, the team determined to next address the problem: delay in receiving test reports for patients in the intensive care unit (ICU).
A cross-functional group was chosen as the process improvement team; they went through a two-day “quality mindset” training and started meeting every two weeks to address the delays in turnaround time (TAT).
Process improvement efforts at the hospital followed the seven steps of problem solving:
- Define the problem and measure it
- Research root causes (using the 5 Whys)
- Discuss and agree upon countermeasures
- Test countermeasures
- Check results
- Standardize results
- Compile quality improvement (QI) story
In addition to these seven steps, the team also incorporated just-in-time (JIT) manufacturing principles by cutting non-value added stages and activities in the process, speeding up and reducing work through automation, and improving workflow.
Step 1: Define the problem and measure it
Problem = (desired state – current state) of “required” TAT
Any TAT exercise starts with identifying the start and end of the process. Each team member was, therefore, asked to state the start and end of their step(s) in the test report delivery process. Their responses are shown in Table 1.
| Table 1: Start and End Steps in Report Delivery Process (Before) | ||
| Team Member | Start of Process | End of Process |
| ICU doctor | Makes test request | Receives report |
| ICU nurse | Takes blood sample | Receives report |
| Laboratory nurse | Receives blood sample | Inputs result in computer |
| Laboratory doctor | Receives blood sample | Signs report |
The ICU doctor requested a test at the start of the process and at the end of the process the same doctor received the results of the test and signed off on the results. The ICU doctor (as the internal customer) set the desired TAT as 20 minutes.
When questioned further, the ICU doctors clarified that their desired TAT time was a maximum of 20 minutes. Statistically speaking, this meant that for 3σ performance, TAT should take fewer than 20 minutes 99.7 percent of the time. Unfortunately, from the start this was known to be impossible as different lab tests take different amounts of time.
Understanding the constraint imposed by the different lab tests, the team then asked the ICU doctors to provide their desired TAT for the most common lab tests. Actual times (times taken for normal operations of tests) were not measured at this stage in the project. It was assumed that the doctors knew the actual times and that their desired times for tests would reflect that knowledge. The desired times are listed in Table 2.
| Table 2: Desired TAT of Laboratory Tests | ||
|
Test Type |
Desired Time of Test (minutes) |
|
|
LFT |
45 |
|
|
PT/PTT |
20 |
|
|
HBsAg/HIV |
120 |
|
|
Blood group typing |
15 |
|
|
Serum electrolytes |
20 |
|
|
FDP |
60 |
|
|
Kt/V |
10 |
|
|
Ab4 |
5 |
|
|
Creatinine |
45 |
|
The final metric emerged at this point. A delay was defined as the actual TAT minus the desired TAT for each test. The average + 3σ of this delay needed to be less than 0 for 99.7 percent of the tests to be within desired levels.
The delay of 10 random tests per day was recorded. In the first week, the results were:
- Average delay = 77 minutes
- Standard deviation (σ) = 58 minutes
- Average + 3σ = 251 minutes
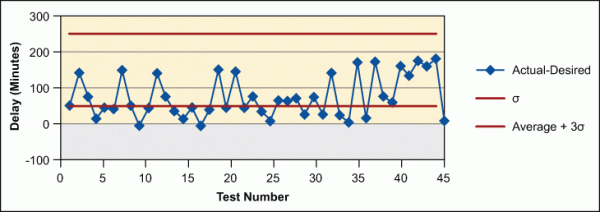
The goal was now defined: reduce 251 minutes to zero. (Although the overall goal was to reduce to zero minutes, a drop of at least 50 percent in the initial go-round of this improvement project would be considered a success). An X-bar control chart for the TAT delay recorded in the first week is shown in Figure 1.

Step 2: Root cause analysis: 5 Whys
When using root cause analysis for TAT problems, the root causes are typically found by mapping the process and identifying all non-value added activities, stages and work on the one hand, and by batching and correcting imbalanced workloads that are impeding workflow on the other.
The process steps are shown in Table 3 below. Cells with a blue background indicate steps that were automated moving forward. Cells with a yellow background indicate non-value-added (NVA) steps that were either eliminated, modified to save time or reallocated.
| Table 3: Sequence Steps for Making and Receiving Laboratory Results – Before | ||||
|
Step Number |
Current Step in Process |
Starts With or Is Handled By |
Ends With (as needed) |
Wait Time Involved |
|
1 |
Requests test |
Doctor |
ICU nurse |
X |
|
2 |
Takes sample |
ICU nurse |
||
|
3 |
Inputs samples into computer, which generates barcode tracker |
ICU nurse |
||
|
4 |
Creates hard copy request form |
ICU nurse |
||
|
5 |
Informs good housekeeping that a “batch” of tests are ready |
ICU nurse |
Good housekeeping (GHK) |
X |
|
6 |
Takes samples to sample receiving station, which receives samples from all locations in the hospital and redirects them to appropriate testing department |
GHK |
Sample receiving station (SRS) |
|
|
7 |
Opens computer data entry window |
SRS |
X |
|
|
8 |
Enters identifier in computer system to match patient to barcode |
SRS |
||
|
9 |
Checks tests, tubes, etc. |
SRS |
||
|
10 |
Attaches barcodes to samples |
SRS |
||
|
11 |
Puts orange stickers on tests that must be completed urgently |
SRS |
||
|
12 |
Sorts trays by department and puts into separate trays |
SRS |
X |
|
|
13 |
Prepares batches of tests |
SRS |
X |
|
|
14 |
Calls GHK to notify them the tests are ready to go to the laboratory |
SRS |
GHK |
X |
|
15 |
Takes tests to laboratory for processing |
GHK |
Lab tech |
|
|
16 |
Enters identifier data into notebook |
Lab tech |
X |
|
|
17 |
Loads samples into centrifuge |
Lab tech |
||
|
18 |
Unloads centrifuge |
Lab tech |
||
|
19 |
Puts samples into test machine trays |
Lab tech |
X |
|
|
20 |
Loads trays into test machines |
Lab tech |
X |
|
|
21 |
Administers tests |
Lab tech |
||
|
22 |
Informs ICU nurse of test reports verbally |
Lab tech |
ICU nurse |
|
|
23 |
Enters test results into computer system |
Lab tech |
X |
|
|
24 |
Prints reports of test results |
Lab tech |
X |
|
|
25 |
Provides reports to head of department for approval |
Lab tech |
Head of department (HOD) |
X |
|
26 |
Signs results in batches |
HOD |
GHK |
X |
|
27 |
Notifies GHS that results are ready |
HOD |
X |
|
|
28 |
Sorts results |
GHK |
X |
|
|
29 |
Delivers reports |
GHK |
ICU nurse |
X |
|
30 |
Informs ICU doctors of test results |
ICU nurse |
X |
|
Step 3: Generate countermeasure ideas
A laboratory test sample was followed to map the entire process as shown in Table 3 and to reveal possible areas for improvement.
Steps 5 through 9 and 12 through 15 were NVA activities and could be eliminated by having the test sample go directly from the ICU to the laboratory rather than going through an intermediary desk. Paper entries (steps 4, 16, 24 and 26) could be eliminated by using the existing computer system; this would also eliminate paper transfers and the waiting involved in locating a messenger, transporting and delivering the reports by hand. With automation, the results could be sent directly from the computer system to the doctors’ mobile telephones.
The improvement project was carried out in two phases, each two areas of the process:
- Process steps supporting, but occurring largely outside, the laboratory
- Process steps occurring in the laboratory
Phase One
The first phase of change proposed is shown alongside the existing process steps in Table 4. (If a proposed step is not noted, no change was made.) Cells with a green background are value-added activities.
| Table 4: Sequence Steps for Making and Receiving Laboratory Results – After | |||||||
|
Step Number |
Current Process Step |
Starts With or Is Handled By |
Ends With (as needed) |
Proposed Step |
Starts With or Is Handled By |
Ends With (as needed) |
|
|
1 |
Makes test request |
Doctor |
Nurse |
Makes test request |
Doctor |
Nurse |
|
|
2 |
Takes sample |
Nurse |
Takes sample |
Nurse |
|||
|
3 |
Inputs samples into computer, which generates barcode tracker |
Nurse |
Inputs samples into computer |
Nurse |
|||
|
4 |
Creates hard copy request form |
Nurse |
Attaches barcodes to samples/attaches orange stickers to relevant samples |
Nurse |
|||
|
5 |
Informs good housekeeping (GHK)(Batch) |
Nurse |
GHK |
Puts samples into trays for laboratory |
Nurse |
||
|
6 |
GHK takes samples to sample receiving station (SRS) [receives samples from all locations in the hospital and redirects them to appropriate testing department] |
GHK |
SRS |
Comes at fixed intervals to pick up trays and deliver them to laboratory |
GHK |
Lab tech |
|
|
7 |
Opens computer data entry window |
SRS |
Scans barcode, which confirms receipt of sample automatically |
Lab tech |
|||
|
8 |
Enters identifier in computer system |
SRS |
Loads samples into centrifuge |
Lab tech |
|||
|
9 |
Checks tests, tubes, etc. |
SRS |
Unloads samples from centrifuge |
Lab tech |
|||
|
10 |
Barcodes |
SRS |
Puts samples into test machine trays |
Lab tech |
|||
|
11 |
Puts orange stickers on tests that must be completed urgently |
SRS |
Loads trays into test machines |
Lab tech |
|||
|
12 |
Sorts trays by department and puts into separate trays |
SRS |
Administers tests, reports are automatically reported into computer system |
Lab tech |
|||
|
13 |
Batches of tests are prepared |
SRS |
Checks and approves (as appropriate) reports |
Lab tech |
|||
|
14 |
Calls GHK to notify them the tests are ready to go to the laboratory |
SRS |
GHK |
Alerts doctors and nurse of test results readiness via information technology solutions (e.g., iPad application) |
Auto |
||
|
15 |
GHK takes tests to laboratory for processing |
GHK |
Lab tech |
Approves hard copy results |
HOD |
||
|
16 |
Laboratory technician enters information in a notebook |
Lab tech |
Delivers at routine, defined intervals |
GHK |
ICU |
||
|
17 |
Loads samples into centrifuge |
Lab tech |
|||||
|
18 |
Unloads centrifuge |
Lab tech |
|||||
|
19 |
Puts samples into test machine trays |
Lab tech |
|||||
|
20 |
Loads trays into test machines |
Lab tech |
|||||
|
21 |
Administers tests |
Lab tech |
|||||
|
22 |
Informs ICU nurse of test reports verbally |
Lab tech |
Nurse |
||||
|
23 |
Enters test results into computer system |
Lab tech |
|||||
|
24 |
Prints test results reports |
Lab tech |
|||||
|
25 |
Provides reports to head of department (HOD) for approval |
Lab tech |
|||||
|
26 |
HOD signs results in batches |
HOD |
GHK |
||||
|
27 |
HOD notifies GHS that results are ready |
HOD |
|||||
|
28 |
GHK sorts results |
GHK |
|||||
|
29 |
Delivers report |
GHK |
Nurse |
||||
|
30 |
Informs ICU doctors of test results |
Nurse |
Doctor |
||||
Step 4: Test the idea
The now 16-step process was then tested – the team was alerted that samples were to be run without delay at any step during this trial. (Steps 7, 12 and 13 would need information technology changes and would be managed with minimum delay for test purposes.) PT/PTT, lipase and amylase are three tests that are expected to take a similar amount of time (TAT). For nine instances pre-project, PT/PTT had average TATs of 95 to 173 minutes (Table 5). The results of a few of those tests after implementing the new procedure are shown in Table 6.
| Table 5: Turnaround Times for PT/PTT Samples – Before | |
|
Test |
TAT (minutes) |
|
PT/PTT |
95 |
|
PT/PTT |
95 |
|
PT/PTT |
95 |
|
PT/PTT |
95 |
|
PT/PTT |
95 |
|
PT/PTT |
173 |
|
PT/PTT |
160 |
|
PT/PTT |
140 |
| Table 6: Turnaround Times for PT/PTT, Lipase and Amylase Samples – After | |
|
Test |
TAT (minutes) |
|
PT/PTT |
54 |
|
Lipase |
56 |
|
Amylase |
60 |
Overall, the TAT delay was reduced by more than 50 percent. Two samples that took longer were incorrectly processed with the existing (more step-intensive) process. All personnel were briefed and a full-scale trial was initiated.
Step 5: Check the result
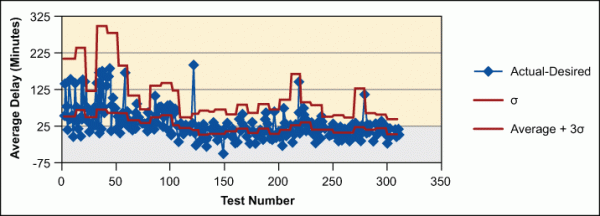
Following a brief period of getting used to the new system, a dramatic improvement took place as shown in the X-bar control chart in Figure 2.

The TAT delay had reduced by approximately 50 percent to 60 percent.
|
TAT |
Before |
After |
|
Average |
90 |
38 |
|
Average + 3σ |
296 |
106 |
When the processes were further streamlined, the average + 3σ reduced by another 50 percent, from 106 minutes to 53 minutes.
Phase 2
The streamlining of the process steps that occurred outside of the laboratory proceeded, along with the necessary information technology changes and updated. Simultaneously, the project team began to address what was happening inside of the laboratory in order to reduce TAT to less than 56 minutes (which is shown in Table 6).
Sample arrival-pattern mapping indicated that the biochemistry and hematology sections were processing the maximum loads of tests. The biochemistry section was selected as the section for the project team to collaborate with as it worked on a new process.
Table 7, below, shows the TAT as recorded in various test batches.
| Table 7: TAT Delays | |||||||
| Test Numbers (each number is an average of ten tests [i.e., 20-29 is ten tests]) |
20-29 |
30-39 |
40-49 |
50-59 |
60-69 |
70-79 |
80-89 |
| Average |
59 |
69 |
48 |
90 |
92 |
58 |
38 |
| Std Dev (σ) |
50 |
57 |
24 |
67 |
61 |
43 |
23 |
| Avg + 3 |
209 |
239 |
120 |
296 |
276 |
187 |
106 |
Steps 2-4: From causes to countermeasures
The process was mapped to identify the reasons for significant TATs and to then develop countermeasures as shown in Table 8.
| Table 8: Sequence Steps for Laboratory Tests | ||||||
|
Step Number |
Current Process Step |
Step Starts With or Is Handled By |
Batch (when appropriate) |
Proposed Step |
Step Is Handled By |
|
|
1 |
Places samples in “in” tray |
GHK |
Places samples in “in” tray |
Lab tech 1 |
||
|
2 |
Pickes up samples when time is available |
Lab tech 1 |
X |
Picks up samples every 30 minutes (up to 24 samples) |
Lab tech 1 |
|
|
3 |
Loads samples into centrifuge |
Lab tech 1 |
Scans barcode |
Lab tech 1 |
||
|
4 |
Enters information in a notebook |
Lab tech 1 |
Loads samples into centrifuge |
Lab tech 1 |
||
|
5 |
Unloads centrifuge, load back in tray |
Lab tech 1 |
X |
Unloads centrifuge |
Lab tech 1 |
|
|
6 |
Picks up samples when time is available |
Lab tech 2 |
Loads trays into biochemical equipment |
Lab tech 1 |
||
|
7 |
Enters information in a notebook |
Lab tech 2 |
Sends results to computer system (automatically by machine) |
Lab tech 1 |
||
|
8 |
Loads samples into biochemical machine trays |
Lab tech 2 |
Approves report electronically |
Lab tech 1 |
||
|
9 |
Loads into biochemical machine |
Lab tech 2 |
HOD approves reports as they are ready |
Lab tech 1 |
||
|
10 |
Cuts and clips printouts of results to initial test requests |
Lab tech 2 |
X |
|||
|
11 |
Enters test results into computer system |
Lab tech 3 |
X |
|||
|
12 |
Prints new results |
Lab tech 3 |
X |
|||
|
13 |
Provides new results to HOD for approval |
Lab tech 3 |
X |
|||
|
14 |
HOD approves results |
HOD |
||||
Four major changes were proposed after mapping the process.
- Compared to the current system in which samples were handed from Technician 1 to Technician 2 to Technician 3, now each technician was tasked with starting their own batches in the centrifuge (24 samples) and carrying them to completion in flow, ensuring a minimum of wait time.
- Paper notebooks were used to track samples in the current system time. Barcode scanners were implemented to automate many steps.
- Several interfaces between the test machines and the computer system were not working, which meant that manual entries and batched report preparations were the only options. These technical issues were fixed to enable more automation and improve flow with batching.
- Electronic signatures were recommended to make hard copies unnecessary for work to progress. Although electronic signatures were introduced, some hard copies were still maintained due to statutory requirements. They could be signed later by the HOD.
Step 5: Check the result
The first trials – even without all of the IT changes in place – demonstrated that one technician could process 24 samples, from requesting a test to issuing the report, within 60 minutes. Two technicians could start a batch of samples every 30 minutes and together complete 48 samples per hour.
Hourly load arrivals were measured; peak ICU lab loads were only 38 samples per hour. The lab could, therefore, handle the ICU loads with a maximum one 60-minute cycle. If all of those ICU samples were in the first batch of 24, TAT would be further reduced. The proposed process would be time-bound – reports would be issued every 30 minutes for all ICU samples received within the previous hour. After the biochemistry department went through the improvement process, the hematology department was similarly improved.
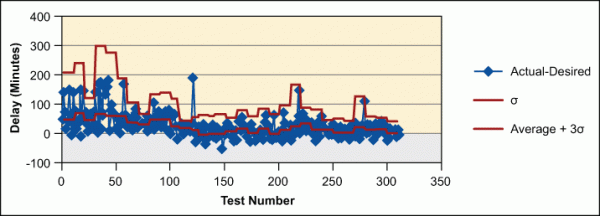
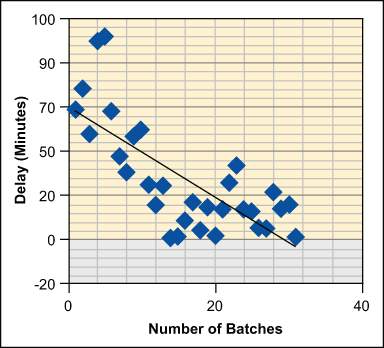
As the automation was implemented and employees got accustomed to the new process, TAT improvement continued as shown in Figures 3 and 4 below.


|
Before |
After |
|
|
Average delay |
77 minutes |
No delay – improved to one minute early |
|
Average + 3σ |
300 minutes |
< 40 minutes |
The ICU doctors proclaimed, “There is no delay from the laboratory.” More than 99.7 percent of reports were completed within 40 minutes, meeting the needs of the doctors.
At the start of this project, the doctors set a desired time of 20 minutes per test. When asked for targets for individual tests, the numbers for desired TAT ranged from 5 minutes to 120 minutes. The average delay resulted in 50 percent completed on time and a maximum delay of 40 minutes per test. The doctors proclamation of “no delay” was their impression of a far faster system. Although some tests continued to take longer than 40 minutes, they no longer took hours.
Step 6: Standardize the results
Team members were trained to draw the control charts, regularly review performance and eliminate the causes of any deviation.
Step 7: Quality improvement story
The quality improvement story was prepared and presented to management.
The healthcare system can be improved enormously by using TQM – first in the supporting processes and then in the medical processes themselves.