Many times it is imperative for a firm to improve the quality of its deliverables even though it is operating consistently at a high sigma level. Such continuous improvement is also necessary when addressing various levels of the capability maturity model integration (CMMI), a software process guide. CMMI Level 5 calls for a proactive reduction in variation and a shift in the mean, while Level 3 involves addressing continuous improvement from a reactive position. The difficulty in completing these tasks, however, is knowing where to start. When no process area is clearly failing, but the drive for continuous improvement remains, such as in the completion of CMMI Level 5, practitioners should use an end-effect rating system to determine where to focus efforts.
Considering Errors
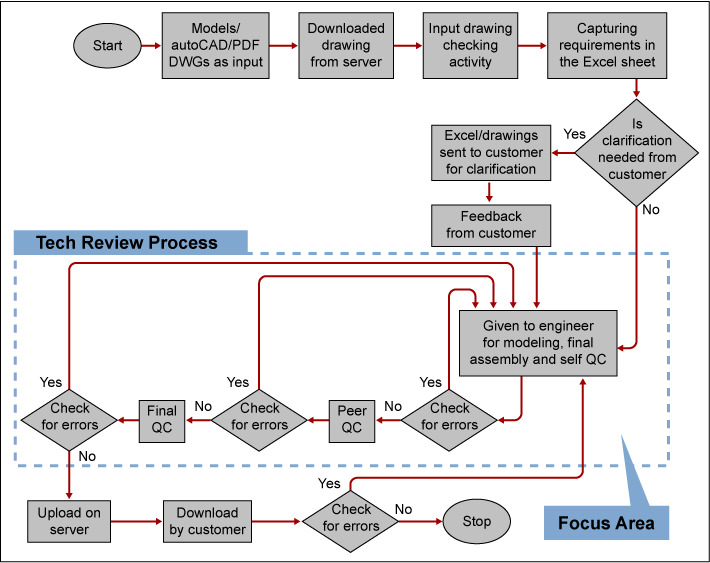
Selecting a direction for improvement can be hard if no one step in a software process is producing significant errors. Consider this example from a service firm that delivers computer aided drafting (CAD) models and drawings, and needs to reduce defects in drawings. Figure 1 shows the generic flow of the activities.

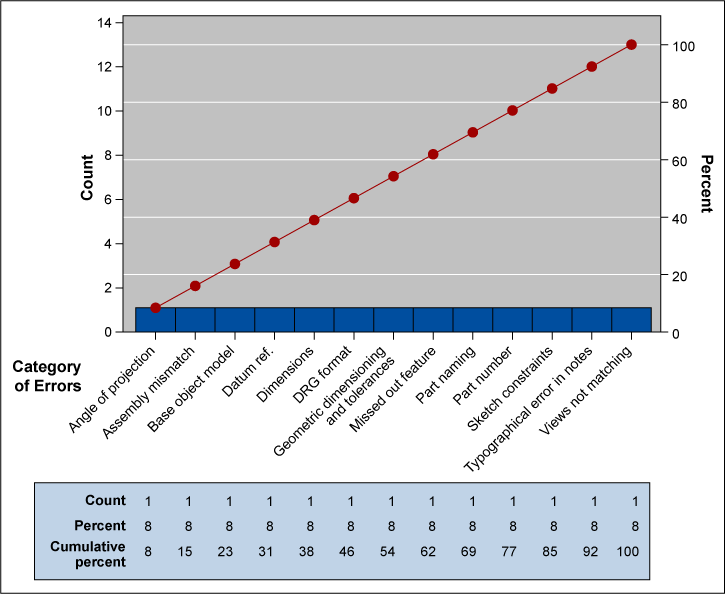
In order to improve the process, the data has to be logged and analyzed. Once the data is captured (Table 1), it can be organized in a Pareto chart for analysis (Figure 2).
| Table 1: Errors in CAD Drawings | |
| Category of Errors | Number of Errors |
| Dimensions | 1 |
| Typographical error in notes | 1 |
| Part number | 1 |
| Base object model (BOM) | 1 |
| Views not matching | 1 |
| Digital raster graphic (DRG) format | 1 |
| Part naming | 1 |
| Angle of projection | 1 |
| Datum reference | 1 |
| Missed out feature | 1 |
| Sketch constraints | 1 |
| Geometric dimensioning and tolerances (GD&T) | 1 |
| Assembly mismatch | 1 |

But it would be inappropriate to use the data in this Pareto to take corrective action; it is a random plot of the data because each category had the same number of errors: one. Other methods must be used to determine the best course of action.
Finding Direction
In order to objectively analyze and take corrective action in instances where a solution is not readily available, a simplified version of the FMEA (failure mode and effects analysis) can be used. The FMEA caters to the Design phase of product life cycle management. CMMI and Six Sigma practitioners use a similar approach to imagine failure during the Design phase and address it by way of either incorporating redundancy or redesign. The following is a simplified version of the FMEA concept. It incorporates a severity number, failure effect number and end effect number, which are assigned to each error category.
Arriving at the End Effect Number
Severity is rated on a scale of 1 to 4, with 4 being the most severe potential consequences of failure. The classifications for each rating are listed in Table 2.
| Table 2: Severity Number Classifications | ||
| Severity Category | Failure Effect | Severity Number |
| Catastrophic | -Loss of life, life threatening or resulting in permanent injury or occupational illness -Loss of launch site facilities -Loss of system -Long-term detrimental environmental effects |
4 |
| Critical | -Temporarily disabling or occupational illness, but not life threatening -Loss or major damage to systems or facilities -Loss or major damage to public or private property -Short-term detrimental effects |
3 |
| Major | -Mission or system degradation | 2 |
| Negligible | -Any other effect | 1 |
The failure effect number is determined using the same four-option scale as the severity number, but is based on the immediate consequences of the failure. The end effect number is the product of the severity number and the failure effect number.
The severity, failure effect and end effect numbers for the CAD example are shown in Table 3.
| Table 3: End Effect Number Calculation | |||
| Category of Errors | Severity Number | Failure Effect Number | End Effect Number |
| Dimensions | 4 | 4 | 16 |
| Typographical error in notes | 1 | 1 | 1 |
| Part number | 1 | 1 | 1 |
| BOM | 2 | 2 | 4 |
| Views not matching | 1 | 1 | 1 |
| DRG format | 1 | 1 | 1 |
| Part naming | 1 | 1 | 1 |
| Angle of projection | 1 | 2 | 2 |
| Datum reference | 3 | 4 | 12 |
| Missed out feature | 4 | 4 | 16 |
| Sketch constraints | 1 | 1 | 1 |
| GD&T | 3 | 4 | 12 |
| Assembly mismatch | 2 | 2 | 4 |
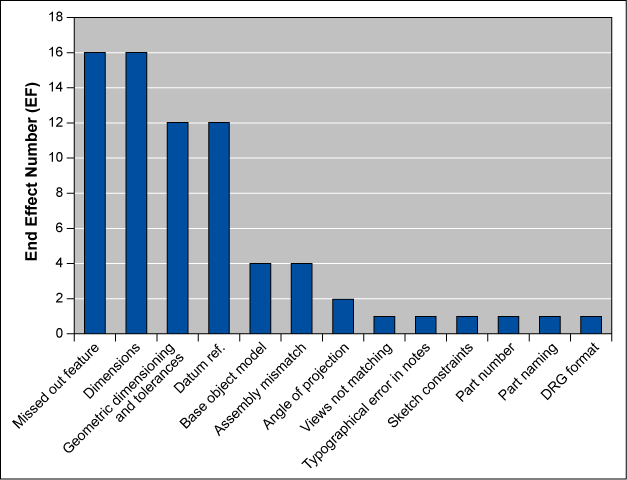
Data may also be sorted and displayed (Figure 3) with regard to the end effect number.

This rating system gives practitioners a more objective understanding and direction as to how to go about further analyzing the data and taking corrective action. This can give rise to a Six Sigma DMAIC (Design, Measure, Analyze, Improve, Control) project, and also justifies continuous improvement toward achieving CMMI Level 5.