
This is a Green Belt project the author led at a large financial data services company. The project was designed to reduce the overall cycle time for procurement to issue a fully approved requisition into a purchase order dispatched to the supplier. Following the Lean Six Sigma (LSS) methodology, part 2 of the case study includes the Analyze, Improve and Control stages of DMAIC. Part 1 featured the Define and Measure stages.
Analyze
The baseline summary shown in Figure 1 details the cycle time from the last measure (in the Measure phase) to the tollgate presentation for the Analyze phase. The average queue time shows a mean of 2.7 days but a large standard deviation of 9. This means that 44 percent of the purchase orders that were being sourced were outside of the upper specification limit (USL) of 5 days, as determined by the voice of the customer surveys sent out in the Define phase.

Root Cause Analysis
It was then time to start a root cause analysis. Table 1 shows the potential root causes on the left and which statistical testing method was used on the right.
| Table 1: Hypothesis Test Plan | |
| Potential Root Cause (from Measure) | Hypothesis Test |
| Business unit | Equal variance, analysis of variance (ANOVA) |
| Dollar amount | Multiple regression, fitted |
| Category | One-way ANOVA |
| Requisition distribution | Multiple regression, fitted line |
| Contract signature | T-test, ANOVA |
Table 2 explores the next step. Tests were completed and the results showed some areas with existing correlation that needed focus and some areas with minor-to-no correlation that could be dismissed.
| Table 2: Hypothesis Testing Results | |
| Hypothesis Tested | Result |
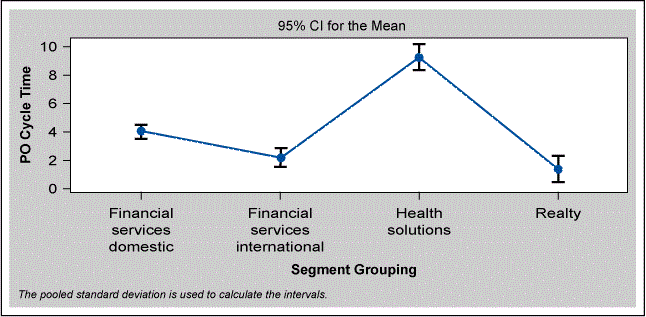
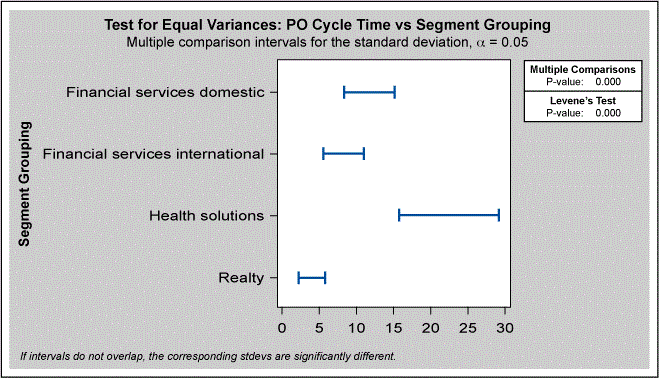
| Business unit/segment grouping | Correlation exists = 8.4% of the issue/correlation exists = 5.21% of the time |
| Dollar amount | No correlation exists |
| Category | Correlation exists = 9% of the issue |
| Requisition distribution | Correlation exists = 96% of the issue |
| Contract signature | Correlation exists = 1.6% of the issue |
| Month of PO | No correlation exists |
| Value bucket | Minor correlation |
| Amount only | Minor correlation |
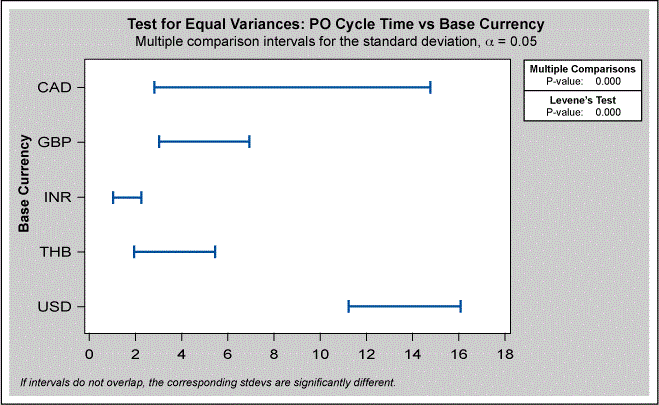
| Base currency | Correlation exists = 5.4% of the issue |
| PO dollar value | No correlation exists |
Figures 2 through 6 illustrate some of the various hypotheses, tests and results, some of which showed some correlation between the subject and the impact on cycle time.
Queue Time
None of the above analyses, however, illustrated the impact that queue time – the amount of time a requisition sits in the queue before it is manually distributed to an analyst for sourcing to a PO – had on cycle time.
In Figure 5, the fitted line graph displays the close connection between cycle time and when and to whom the purchase orders are distributed with an R-square (the statistical measure of how close the data is to the fitted regression line) of 96 percent.
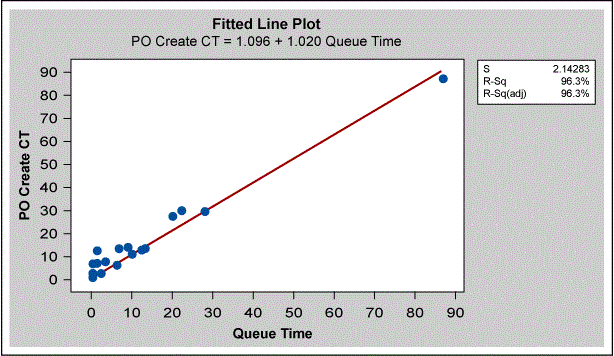
Figure 6 confirms that how requisitions are distributed dramatically impacts the cycle time. The analysis shows a mean queue time of 7 days, which is already above the USL for the entire cycle time.
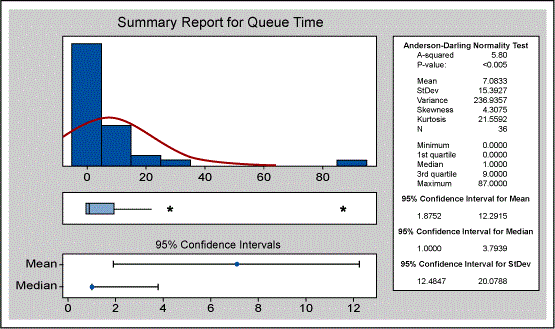
The as-is process for requisition distribution requires an automated email to be distributed to one analyst (each team sourcing team member takes a turn weekly) to, in turn, distribute to another buyer. There are numerous issues with this distribution method.
- What if the designated buyer is out of the office during their specified week?
- What if the person receiving the requisition to source is out of the office?
- What if other responsibilities cause a delay in a day or two when they should be passing out requisitions?
There are many more possibilities of errors that can occur at this failure point.
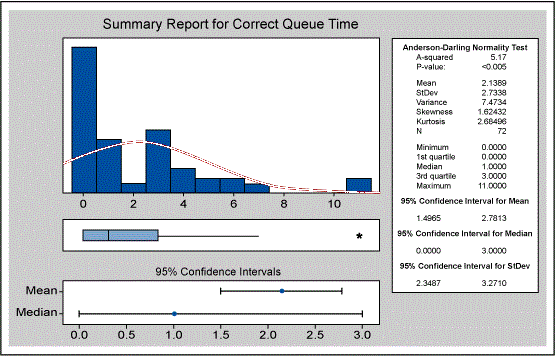
Once requisitions are directed to the correct person, they are sourced extremely quickly. (See Figure 7.) With a mean of 2.1 and a standard deviation of 2.7 days, it’s clear that automation around the distribution of purchase orders will help to clear up the cycle time issues. Here, the mean, standard deviation and p-value relate to the amount of time the requisition sits once in the correct queue before being sourced to a purchase order.
Figures 8 and 9 look at the relationship among categories (e.g., software and hardware) and the cycle time as well as value buckets (e.g., requisitions in the categories of less than $50K or less than $100K). The hypothesis was that the higher the dollar requisition, the more attention it received and the less likely it was to contribute to the delay in cycle time. The tests also shed some light on how requisitions should be segmented toward the buyers.


A vital few validated root causes were discovered:
- Requisition distribution
- p-value = 0.00
- R-squared (adjusted) = 96 percent
- Business unit/segment grouping
- p-value = 0.00
- R-squared (adjusted) = 8.4 percent
- Base currency
- p-value = 0.00
- R-squared (adjusted) = 5.4 percent
Improve
After examining the requisition distribution and cycle time relationship, we came up with potential improvement solutions:
- Redesign the team distribution queues so they no longer require manual distribution.
- Work with the enterprise resource planning (ERP) system teams to automate distribution of requisitions based upon coding, dollar amount, etc.
- All requisitions to be sourced through the Procurement to Pay (P2P) team.
- Some categories that do not require manual intervention to be auto-sourced.
- Requisitions are automatically directed to Sourcing Associates for approval based upon category assignments.
- Strategic Sourcing Associates are now in the requisition approval chain for both reviews and approvals. After approval, the requisition either auto-sources or is sent to the P2P team for manual processing.
- Create dashboards and work centers to allow associates to see all requisitions in one place, and for managers to see the length of time a PO has been in queue.
Implementation Plan
We created a detailed implementation plan for the massive changes related to this effort. The highlights included multiple training and testing features prior to the “go live” date as well as a Gantt chart to ensure the project was managed to the strict timeline. The analysts’ detailed training included a playbook and multiple training sessions.
As an example of one of the changes, each manager is now required to assign an employee to categories, so the system will automatically route the requisitions to their space for approval. Once the associate reviews the requisition to determine it contains the appropriate pricing and that other details are correct, they approve the requisition. It then either auto-sources or goes directly to the P2P queue for sourcing. All approved requisitions that enter the P2P queue by 2 p.m. CST are sourced the same day. In rare cases, requisitions approved after that deadline could be sourced with the proper approvals. If an analyst is out of the office, their manager can approve the requisitions on their behalf. The associates can also delegate approval to a proxy if necessary.
Communication Plan
Next came detailed work instructions and a communication plan for the key stakeholders. This was important because the change led to significant changes to several areas of the company. To ensure this was successful, project management and communication skills were critical. Every detail was thought through, and all areas that would be affected were consulted and walked through the new process.
Improvements to Cycle Time
Figures 10 and 11 spotlight the immense immediate impact this project had on cycle time. Figure 10 is the measure from the Analyze tollgate to the Improve tollgate (approximately one month). The mean time to issue a purchase order from a fully approved requisition was 7 days with a high standard deviation of 15. A clear majority of POs were outside of the USL.
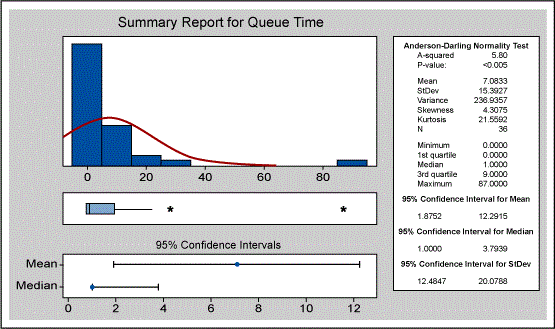
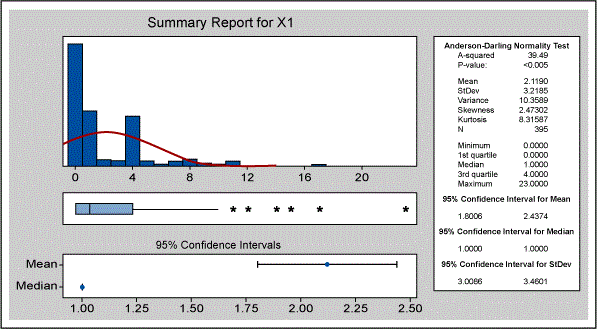
Figure 11 shows the improvement the project was able to make. At approximately 2.5 months into the deployment of changes into production, the mean was shifted down to 2 days with a low standard deviation of 3.
Project Results
The initial project goals became obsolete due to the significant improvements made during this project. While the charter notes the goal was to increase the number of POs by 6 POs per associate to increase productivity, the changes implemented during the Improve phase added far more productivity than expected. We experienced a shift from 19 full-time employees (FTEs) issuing purchase orders to two FTEs. Between the 2 FTEs and the vastly improved streamline process, the PO per associate ratio increased from 44 POs per associate to 56 POs per associate – far exceeding our initial project charter goals.
Further results included:
- A significant shift from a model in which the focus of global procurement associates was tied to a supplier to one in which the associates focused on categories instead. This resulted in team members having a more complete industry perspective, which led to further cost reductions as associates became better at negotiating market prices.
- Shift from a focus on processing tactical work to a strategic view.
- Associates were easily able to exceed the costs savings quota (SAR) of $5.5M and have continued to do more with fewer FTEs.
Control
We developed a control plan that includes two key features:
- Each manager has a built-in dashboard that shows every employee that reports to them, the number of POs in their queue waiting for approval, the visibility to what is currently in the P2P queue waiting to be sourced, and the overall cycle time for each group (Strategic Sourcing and P2P).
- Managers have the ability to see bottlenecks in real time and can shift requisitions to other associates to ensure no one person is overwhelmed.
Hidden Project Impacts
Once in the Control phase, more benefits appeared that went beyond the project’s original scope captured in the project charter. These bonus benefits included:
- Several areas that were previously manually sourced were able to be shifted to catalogs and, thus, auto-sourced.
- The revised categories aligned with a larger corporate focus of hiring IT lifecycle managers allowing for greater collaboration and focus.
- More specialized knowledge around categories was developed, which helped negotiations and relationships with various other business units.