
The Improve Phase
Having identified and verified ways that support cost is driven by staffing ratios, process factors like transfers and callbacks, and the proportion of phone and web traffic, the Six Sigma project team of the IT services business began identifying and selecting among solutions. It had entered the Improve phase. The DMAIC (Define, Measure, Analyze, Improve, Control) roadmap called for work in these areas during the Improve phase:
I1. Identify Solution Alternatives to Address Critical X’s: Consider solution alternatives from the possibilities identified earlier and decide which ones are worth pursuing further.
I2. Verify the Relationships Between X’s and Y‘s: What are the dynamics connecting the process X‘s (inputs, KPIVs) with the critical outputs (CTQs, KPOVs)?
I3. Select and Tune the Solution: Using predicted performance and net value, decide what is the best solution alternative.
I4. Pilot / Implement Solution: If possible, pilot the solution to demonstrate results and to verify no unintended side effects.
I1. Identify Solution Alternatives to Address Critical X‘s
Work done during the Analyze phase identified several areas of prospective improvements that could deliver project results. The solution alternatives were:
| Driving Xs (from Analyze phase) | Solution Alternatives |
| Staffing | + Add staff Mondays and Fridays, reduce staff on Sundays + Develop staffing model + Create on-call list to fill-in for absentees |
| Web Service Percentage | + Focus on services that can be done best on the Web + Define and communicate the value prop to customers + Evaluate incentives to move traffic to the Web |
| Transfers and Callbacks | + Improve call center processes to reduce transfers and callbacks without impacting customer satisfaction |
The team began to think through how each of these alternatives would work – how it would compare/contrast with the current state, and what the costs, benefits and risks are regarding each CTQ for each of the following stakeholders?
Business: Net value = ($Benefit – $Cost) and other benefits and risks.
Customers: Functionality and value.
Employees (as appropriate): Working conditions, interesting work and growth opportunities.
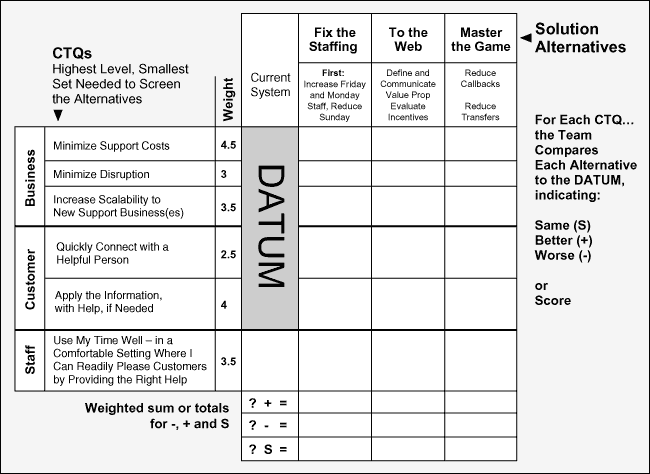
To understand and compare each solution alternative, the team realized it would need to describe and characterize each of them with respect to the key requirements. The characterization work is the core of step I2, and the population and work-through of the selection matrix is the main activity in I3. A solution selection matrix (Figure 1), empty of evaluations during I1, formed the basis of the team’s planning for the characterization work. (The matrix is an extract or simplified view of the “real thing.”)
I2. Verify the Relationships Between x’s and Y(s)
For each solution alternative, a sub-team worked through a series of comparisons and characterizations in order to check and quantify the key X-Y relationships that could be exploited for that alternative. Each group began by determining the magnitude of the potential business benefit. To do that, it was necessary to know the X-Y relationship, known as the “transfer function.” If the potential benefit appeared to be significant, then the group had to evaluate how the improvement might be implemented, and what it would cost. Obviously the alternative passed if benefits meaningfully exceeded the likely cost of the improvement. If not, it was eliminated.
The staffing option is an illustration of the process used. To examine the other options, the team followed similar thought processes, but perhaps applied a somewhat different combination of tools. To evaluate the staffing option, the team asked this series of questions:
1. Which variables will be impacted, and by how much? Wait time, support cost, volume/staff (v/s) ratio.
2. How will the benefit be measured? Value of account growth minus the cost of additional staff.
3. What chain of analysis will be used to show the connection between additional staff and account growth? By definition, staffing drives v/s ratio. Does v/s ratio drive wait time? Does wait time drive account growth? How many staff might be added? How would that impact wait time? How much benefit would that staffing level produce? What would it cost?
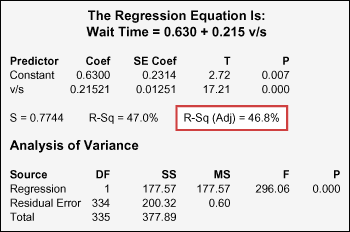
Using regression analysis with the data collected, the team saw that the variation in wait time seemed in part to be related to the v/s ratio. (Figure 2) While this did not prove causality and there clearly were other influentialing factors, the team suspected a meaningful connection (subject to stronger proof later) and decided to pursue this clue further.
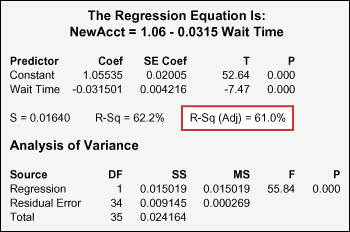
Next, the team wanted to know if wait time was driving account growth – and, if so, by how much. The team again applied regression analysis. (Figure 3) It appeared that 61 percent of the variation in account growth could be attributed to wait time. Again, this was not conclusive proof, but wait time was a worthy suspect.
To understand the number of staff that might be added or reduced, the team considered each day separately. The team decided to see what would happen, on paper, if the volume/staff ratio for each day was adjusted to the overall average (i.e., increase staff on Mondays and Fridays to get to the average v/s ratio, decrease staff to get to the average v/s ratio on Sundays). The team found that meant adding 14 people to the call center staff on Mondays. Combining what it had learned about the wait time-v/s ratio connection (Figure 2), the team forecast a 1.18-minute reduction in wait time on Mondays. The team used the following calculations:
As Is = .63 + (.215 x 23) = 5.57 Minutes
To Be = .63 + (.215 x 17.5) = 4.39 Minutes
5.57 – 4.39 = 1.18-Minute Wait Time Reduction
The team then evaluated the likely impact of wait time on new account growth using information from Figure 3.
As Is = 1.06 – (.0315 x 5.575) = 0.884%
To Be = 1.06 – (.0315 x 4.3925) = 0.921%
.921 – .884 = 0.037% New Account Growth
The accounting department was asked to provide some of the facts needed to find out the incremental value of the projected new account growth. They reported that there were 1,484,000 accounts and the average annual profit per account was $630. With this information and what the team already knew, it could calculate the financial impact.
0.037% New Account Growth x 1,484,000 Existing Accounts = 549 New Accounts
549 Accounts x $680 Average Profit Per Account = $345,870 Incremental Annual Profit
Next the team calculated the additional staffing cost and the net benefit to the business.
Staff Cost = 14 People x 8 Hours x $30 Per Hour = $4,480 x 50 Weeks = $168,000
$345,870 Incremental Profit – $168,000 Staff Cost = $177,870 Project Net Benefit to Business
The team completed a similar quantitative analysis of each of the options. Included among them were one on web service and one on transfers and callbacks. An improvement summary was written for each.
Web Service Implementation Summary
Benefit: $280,080 (savings of $1,167 x 240 days per year).
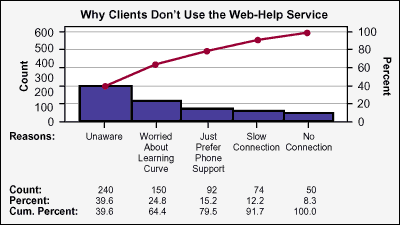
Approach: Increase client awareness about web service and help clients see how easy it is to use. (Figure 4)
Risks: Verify that the web system can handle increased volume. Verify that customer satisfaction does not slip.
Method: Insert in upcoming mailings describing web services and interface. Announcement on the phone router switch that answers all calls.
Transfer and Callback Implementation Summary
Benefit: $143,293 (annual savings of $104,233 + additional profit of $39,060).
Approach: In a focus group session with current staff, it was learned that almost half had not be trained on policy and system changes implemented nine months before. The data was stratified by those trained and those not. A t-test was used to compare transfer and callback percentages. The comparison showed that the untrained were more than three times as likely to have high percentages (p=.004). The conclusion was provide training.
Risks: No way to calculate how quickly the training will drive the percentage down. There may be a learning curve effect in addition to the training. Also making staff available for training is an issue because training is only done on the first Monday of each month.
Method: Considering risks, the decision was made to train 50 percent of those in need of training and evaluate the impact in a three-month pilot program. If that worked, the second half would be trained in the following quarter.
Costs: One day of training for approximately 15 people in the pilot program = cost of training ($750 per student x 15) + cost of payroll (8 hours x $50 x 15) = $14,850. If fully effective immediately, this penciled out to about half of the potential benefit. Discounting for risk, the team projected a first quarter gross (before costs) benefit of approximately $50,000.
When the team had completed a similar quantitative analysis of each of the options, it prepared a summary comparison and was ready to make recommendations for the next steps.
I3. Select and Tune the Solution
The team did not pursue tuning the solution in the context of this project, although it recognized there might be opportunities to further optimize performance of the web component.
Based on everything the team had learned, it recommended:
- Start with staffing (the “quick fix”). It is the fastest and surest way to stem the erosion of business growth. (“We recognize it is costly and not highly scalable (to other centers, other languages, etc.). This should be a first step, with the hope that it can be supplanted as the solution elements in other recommendations reduce staff needs.)
- Web service percent. Begin right away tracking the call volume and customer satisfaction with this service mode.
- Transfer and callback reduction. Start right away. This is a “no brainer” net benefit that should work well in parallel with the first two solution elements.
Before moving into the pilot phase, the team decided to meet with one of the Master Black Belts to get a sanity check on its work to that point.
MBB Review/Critique and Champion’s Reaction
The Master Black Belt reviewed the team’s work through I3 and raised strong concerns about the forecasts it had made for the increased staffing option. He pointed out that weaknesses in the measurement system feeding values into their regression analysis, together with the wide prediction interval around the team’s estimates (which had been treated as precise point values) put considerable risk around the expectation that projected benefits would be realized.
Although the Master Black Belt’s feedback was a bit sobering, the team still felt it wanted to go ahead with the pilot program. But it decided to do an interim review with the Champion first, including briefing him on the MBB’s perspective. Here’s a snippet of the Champion’s reactions to the review:
“First let me say I think this team has done a fine job so far – you’ve found potentially substantial savings, you’ve got good supporting factual information, and you’ve pointed out the risks and uncertainties brought out by your MBB.
“While I don’t at all dispute the issues brought out by the MBB, my perspective is a little different than his. The CEO has told me in no uncertain terms that he wants our account growth to match the competition, and soon. He made it clear this is a strategic imperative. Customers have lots of choices, and we could lose out big time if we don’t turn this around right away. It has been let slide for too long as it is. So, in spite of the issues raised by the MBB, I’m prepared to spend some money to pilot this because if it works, we will get quick results. It is evident that adding staff will help us more quickly than any of the other options. We can always cut back staff later as these other improvements take hold. Turnover in this area is high anyway, so reducing staff will be painless when the time comes.”
I4. Pilot / Implement Solution
The team developed a plan for the pilot program in staff training that addressed the practical considerations for success.
- Preparation and deployment steps for putting the pilot solution in place.
- Measures in place to track results and to detect unintended side effects.
- Awareness of people issues.
Details of the plan for the Monday staffing pilot program included the following elements:
- X‘s to adjust: Staffing level (add five for pilot, full increment to wait for evidence plan works)
- Y‘s to measure for impact and unintended side effects:
- Wait time, v/s ratio, customer satisfaction, transfers, callbacks, service time.
- Compare “new staff” versus “old staff” (hypothesis test).
- Measure monthly to observe learning curve effect, if any.
- Measurement system issues: Revise existing sampling plan and data collection process to distinguish new staff from old staff.
- Because the current customer satisfaction sampling gives only 1 data point per month (not enough to see a change), arrange a special sample – 5 per day for the first 60 days of the pilot (80 percent from existing staff, 20 percent from new staff).
- People and logistics issues: Communicate what is happening and why. Emphasize evaluation is not of individuals, only overall impact.
The team then conducted the pilot program and evaluated the results. The objective was to do before/after analysis (hypothesis tests to evaluate significance of outcomes), ask what was learned, refine the improvement if indicated and confirm or revise the business case.
A number of significant questions needed to be answered in the results of the pilot program. Among the most important questions and answers were:
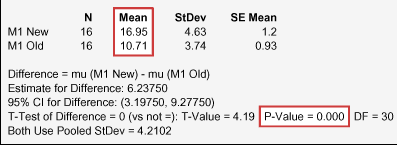
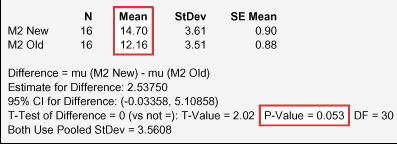
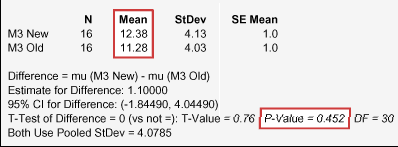
1. Did the additional staffing, and the resulting change in v/s ratio, impact wait time as expected? The team looked at the results month by month to see if there was a learning curve effect with the new staff. There was an effect, but the new staff nearly caught up by the end of the third month. During the first month, “new staff” calls took seven minutes longer than “old staff” calls. During the second month, the difference was down to 2.5 minutes. And by the third month, the difference was about one minute. (Figures 5, 6 and 7)
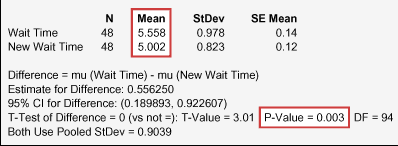
2. Did wait time decrease as expected? Wait time was lower by 10 percent – just what was expected when the staff was increased by 10 percent.
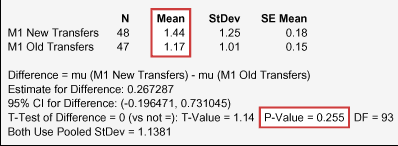
3. Did the new staff have any impact on transfers? New staff had slightly more transfers, but the number was not statistically significant.
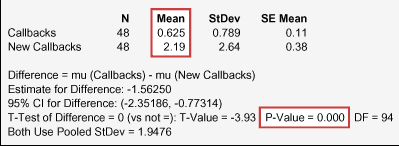
4. Did the new staff have any impact on callbacks? New staff had 1.5 times more callbacks. This was a concern. The team needed to determine if this was a learning curve issue, and if not, how the additional callbacks can be controlled.
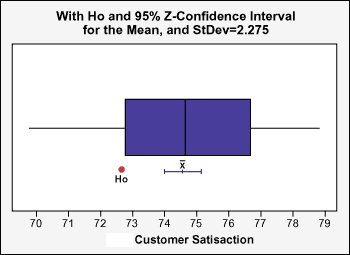
5. What happened to customer satisfaction? New data on customer satisfaction after the pilot program confirmed the team’s expectation of improvement. The company moved from less than 73 percent to about 74.5 percent.
After the pilot program on staffing was complete, the team was ready for the Improve tollgate review with the project Champion. Here is what the team reported on the staffing issue during the review:
- Wait time was reduced by ~ 10 percent (to 5 minutes).
- Volume/staff ratio was reduced to 1100/54 = 20.37 (versus. 23 before).
- Predicted wait time = .63 + (.214 x 20.37) = 5.0 (agrees with actual).
- New staff had longer service time initially, but reached group average in three months (reflects learning curve).
- New staff had slightly more transfers, but not statistically significant.
- New staff had an average of about 1.5 more callbacks. This may need to be addressed, but is likely related to learning curve.
- If transfers are the same as before and callbacks increase by
[.10 x 1.5 = .015 the impact on wait time = 3.68 + (.643 x 1.23) + (.139 x .505)] = 5.41
(i.e. negligible impact, as before the change the number was 5.40)
- If transfers are the same as before and callbacks increase by
- Customer Satisfaction had increased, and the change was significant.
- Conclusion: The Monday staffing pilot program was a success and the team recommended full implementation.
Part 6, the conclusion of this case study-tutorial, is about the Control phase of the project.