The following is Part Two of a two-part article. Part One follows the first three steps of a DMAIC (Define, Measure, Analyze, Improve, Control) project at Kahiki Foods. Part Two follows the completion of the DMAIC project – the Improve and Control steps.
Improve
The enhanced choke-point analysis completed in Analyze verified the chicken processing and packaging rates for each chicken SKU (stock-keeping unit). It became clearer to the team that X pounds per minute (lb/min) of chicken can be processed; therefore, only X lbs/min or less can be scheduled for packaging in order to operate free of WIP (work in process). This revelation led to the development of a balancing tool to assist in production leveling, which was repeated for the other production lines. The data also was used to justify production buffers to control WIP.
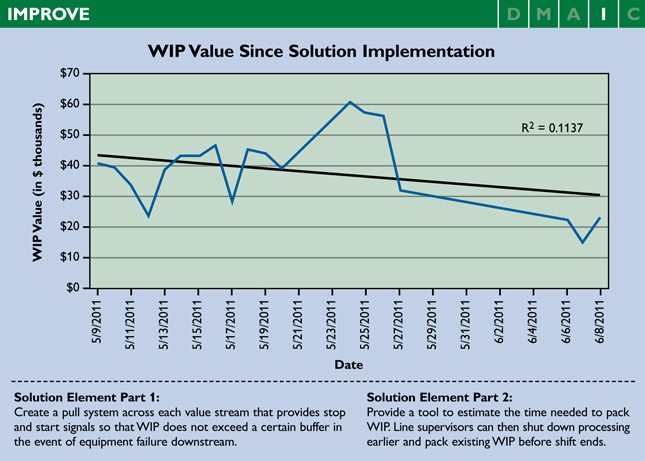
The improvement strategy was two-fold. First, the team implemented a pull system between processing and packaging. In the event that a packaging line goes down, upstream processes are temporarily stopped until the issue is resolved. For each line, an optimal buffer was defined based on the equipment throughput found during the capacity analysis. A standard operating procedure (SOP) was created, instituting clear stop and start signals to minimize WIP buildup during downtime and not exceed the defined buffer. The SOP was audited during a two-week pilot test, and a final version was updated for use on the floor.
The second part of the strategy was to develop a method of eliminating WIP that occurs before the shift ends. The team created a tool that estimates the time it takes to package WIP, based on the capacity analysis data. The user inputs the number of pallets of WIP and the tool calculates the amount of time needed to package that WIP, based on the SKUs scheduled for that day. Line supervisors can then shut down processing earlier and package existing WIP before the shift ends.
During the two-week trial run, there was a downward shift in WIP levels. In Stage 1, the average WIP level (current state) was $51,838, with a standard deviation of $28,282. During the trial period (Stage 3), the average WIP level was $38,689, with the standard deviation being $12,354. The team tracked WIP levels before and during the project, and then during and after the pilot.
A Levene’s test was used to prove that a significant shift occurred between the standard deviation of two non-normal continuous data samples: the baseline-state WIP level (Stage 1) and the solution trial-period WIP level (Stage 3). Using an alpha level of 0.05, the test yielded a test statistic equal to 7.95 and a p-value of 0.00. Because the p-value was less than 0.05, the null hypothesis was rejected and the team concluded that the standard deviation of Stage 3 was significantly less than that of Stage 1.
Mood’s median test also was used to show that the median of the Stage 3 data set was significantly less than the median of Stage 1 at an alpha of 0.05. The Mood’s test – selected because the samples were not normally distributed – yielded a chi-square of 23.75 and a p-value of 0.00, providing sufficient evidence to conclude that there was a significant shift in the medians between Stages 1 and 3.
The solution elements indicated that they might serve to lower WIP levels and also reduce the variation in the process. These improvements were approved and a full rollout began immediately. There were many operational bugs to work out in the new system, but the sponsors and Champion believed that the solution should be implemented and fully supported the rollout and the progression of the project to the Control phase.

Control
The team developed and put into place five Control elements:
- A sustainable, visible measurement system for the Y and key x’s;
- An SOP for training and operating procedures, plus execution of the initial training;
- Accountability measures (e.g., process capability sustainability of the primary Y built into the process owners’ performance management systems and annual objectives);
- A project transition action plan, which passes the baton from the project manager to the accountable agents to sustain the new performance levels; and
- Failure mode and effects analysis to determine what could go wrong and what should be done to correct those problems.
The capacity analysis document displays all of the theoretical maximum throughputs for each piece of equipment on the floor. However, the accuracy of the document will change as material and equipment changes. To ensure that the document is accurately maintained, the entire team was shown how to update the document, including how to edit specifications for existing products, add new products and edit equipment settings. The production operating system manager serves as the ultimate document owner. Line leaders for each shift then would transfer the responsibility to each senior or lead employee on the line to continue to maintain the piloted improvements.
Sustainability of this project is important to increase shareholder value for Kahiki. If proper asset efficiencies are not maintained, any inefficiencies will be compounded as the company expands. Elements of WIP management specific to this project include increasing the use of just-in-time processing and also rationalizing production quantities through the use of optimal buffers.
