The following is Part One of a two-part article. Part One follows the first three steps of a DMAIC (Define, Measure, Analyze, Improve, Control) project at Kahiki Foods. Part Two follows the completion of the DMAIC project – the Improve and Control steps.
Kahiki Foods is an expanding, family-run Asian foods manufacturer with about 200 employees in Gahanna, Ohio, USA. The company produces more than 70 different kinds of frozen food products. As is typically the case with rapid growth, some operational processes have been slower to reach maturity, including the optimal management of work in process (WIP), the amount of work that has entered the process but has not been completed.
Kahiki’s inventory management system determined that about 80 percent of all stock-keeping units (SKUs) were scheduled for WIP, which leads to additional labor, increased transportation and extra storage costs. Perhaps most significant, WIP also can destroy flow.
The variation in valuation and costs associated with WIP, referred to as price recovery, could contaminate or mask the understanding of the true shifts in productivity. But because, historically, it was the only metric available in the inventory management software system, the project improvement team decided to use variation (WIP daily valuation) as the project metric. They would evaluate the impact of price recovery over time and strip that effect out.
The objective of this DMAIC project was to reduce the WIP levels to controlled buffers by creating a pull system for the product in order to eventually eliminate WIP creation from the process. The scope of this project reached as far upstream as production scheduling and as far downstream as product packaging.
The core team was comprised of the president of the business, the general manager of operations, the plant process improvement engineer (an industrial engineer and Black Belt) and the process owners from both shifts. The chief financial officer and associated subject matter experts (e.g., production scheduling and quality assurance team members) also were called upon frequently, and most participated in all tollgates.
Define
The primary defect (Y) for this project was daily WIP. The primary metric by which WIP levels were measured was the daily extended monetary value of WIP, as recorded by the inventory management software system. The average daily extended value of WIP for the facility was $51,565 from August 2009 through December 2010, with significant day-to-day swings. As noted previously, daily valuation of WIP was utilized as the metric for the primary Y because it was the only metric for the defect for which historical data was available.
In the system that existed when the project started, roughly 80 percent of all SKUs were scheduled for WIP. In addition to the expected benefits from reducing this WIP, the project also revealed cost savings opportunities associated with pallet wrapping, increased sanitation requirements and energy loss issues with increased use of the freezer door.
The voice of the business was loud and clear: Migrate the plant toward zero WIP with this project. The voice of the customer was captured by sales and marketing, and was somewhat causally “distant” from this project, but not ignored in the Define phase.

Measure
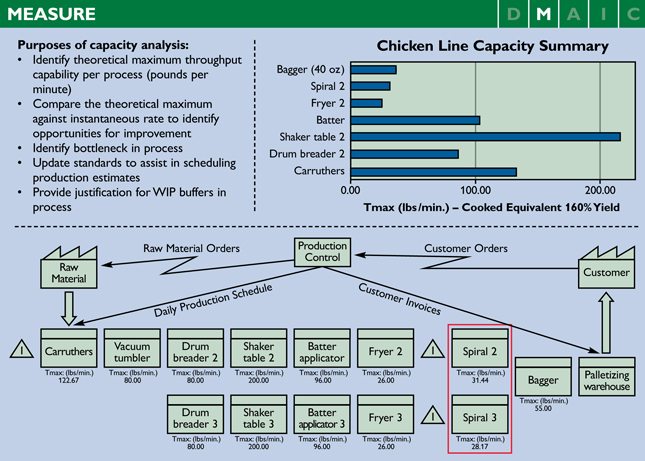
A closer look at each product line allowed the team to better understand what was happening on the floor. A thorough capacity analysis of the facility was performed to identify bottlenecks in the process and quantify the true capacity on each line.
The team developed a measurement plan that was comprehensive enough to support the successful completion of the project. Data requirements for all stages of DMAIC were incorporated in the master measurement and evaluation plan in the early part of Measure. Many discussions were held around the proper metric for the primary Y, but the team could not arrive at an operational metric that was sustainable other than what was already being tracked in the inventory management system.
The team continued to work on separating out the impact of any price recovery on the primary Y. Separating price recovery from productivity improvement allowed for the use of a currency metric and, hence, a common denominator across SKUs (inventory items, not product families).
A high-level value stream map (VSM) was created to depict the current state of the process. The red box in the process map (see Figure 2) identifies the major choke point in the process and, thus, a major driver for WIP. With deeper investigation, it became clear that WIP also had become part of the culture; WIP was the way the work was done. People were not conscious of the costs of this practice and that there were alternative ways to achieve smooth flow and efficiency.
Along with the high-level VSM, the team created more detailed VSMs to address specific product lines. A value stream/product-family-level analysis was done to examine the following attributes of the system for possible WIP:
Line priming – This activity, part of the standard operating practices, used WIP at the beginning of each shift so that packaging was able to start immediately, even before food processing had started. This allowed associates downstream to begin working right at the start of the shift. The team determined that line priming represented about $10,000 a day in the Y metric.
SKU stratification – By dividing up the process into individual SKUs, the team could better understand which product lines were the main contributors to WIP levels. From this data collection and initial analysis of current-state process capability, the team discovered that the chicken line represented the bulk of the WIP: 42 percent, or roughly $20,000, a day in the Y metric. However, the root cause of the high level of WIP was believed to have come from lack of production harmonization.
Production harmony – This idea came about through the measurement of imbalances in the value stream, particularly between processing and packaging. To understand the harmony (or lack thereof) for these value streams, the team conducted a detailed choke-point analysis. The analysis involved exploring and verifying the theoretical maximum throughput for each piece of equipment, followed by a value stream line-balancing analysis. Production harmonization involves the integration between production scheduling and operations, and is the reason that the project’s scope extended upstream to production scheduling.
After analyzing the current-state process capability and the initial cause-and-effect diagram, the team believed that $40,000, or 80 percent of the defect, came from issues with production harmonization.

Analyze
The strategy in Analyze was to increase the engagement of the team in analysis and in identifying solutions.
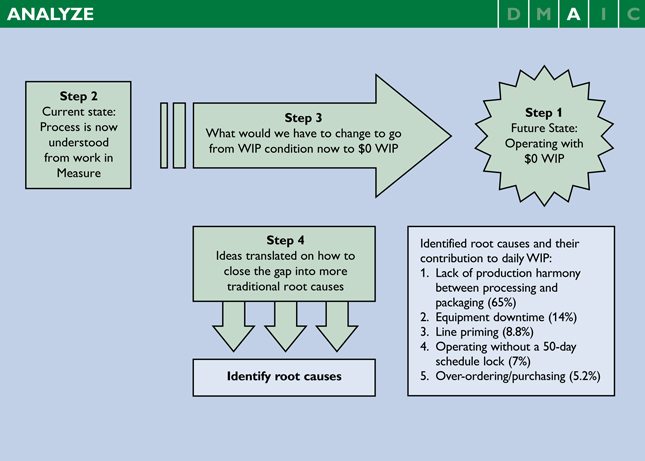
The team used a four-step process. The first step was to establish whether the process owners and employees viewed “zero WIP” as a realistic goal; all stakeholders indeed felt that this was doable. Step 2 was to share what was learned in the Measure phase about current-state process capability.
Next, in Step 3, the team began its root cause analysis from the “front door” rather than the “back door.” It determined what it would have to do to close the performance gap – to go from more than $50,000 in average daily WIP to $0. In Step 4, the team inferred the forces that held it back from this goal – that is, the root causes of WIP.
In Steps 3 and 4, the following obstacles were identified: overproduction, lack of attention to WIP, continuation of processing while packaging was down, outdated process yield standards, lack of a five-day schedule lock, overordering, and lack of understanding of production harmony.
The team then performed a 5-why analysis on these elements to see if any common root causes contributed to these obstacles. Three root causes surfaced: 1) lack of production harmony between processing and packaging, 2) equipment downtime and 3) line priming. The choke-point analysis from Measure was audited and built out to create a scheduling tool, outlining the different SKUs and their production rates. This enabled the team to understand which combinations of SKUs can be scheduled in parallel so that WIP is not created.

Part Two of this article follows the completion of the DMAIC project – the Improve and Control steps.