Key Points
- Z-score is a standard measurement used in statistical analysis that looks at data with a normal distribution.
- It provides a standard unit of measurement for placing your data on a common scale.
- It cannot be used with non-normal data, so take appropriate measures where needed.
Some say that Z is the sign of Zorro (Spanish for fox), the fictional sword-wielding masked vigilante who defended and helped the poor. In statistics, it is something different. In statistics, z usually refers to the standardized score or z-score of a data point in a normal distribution.
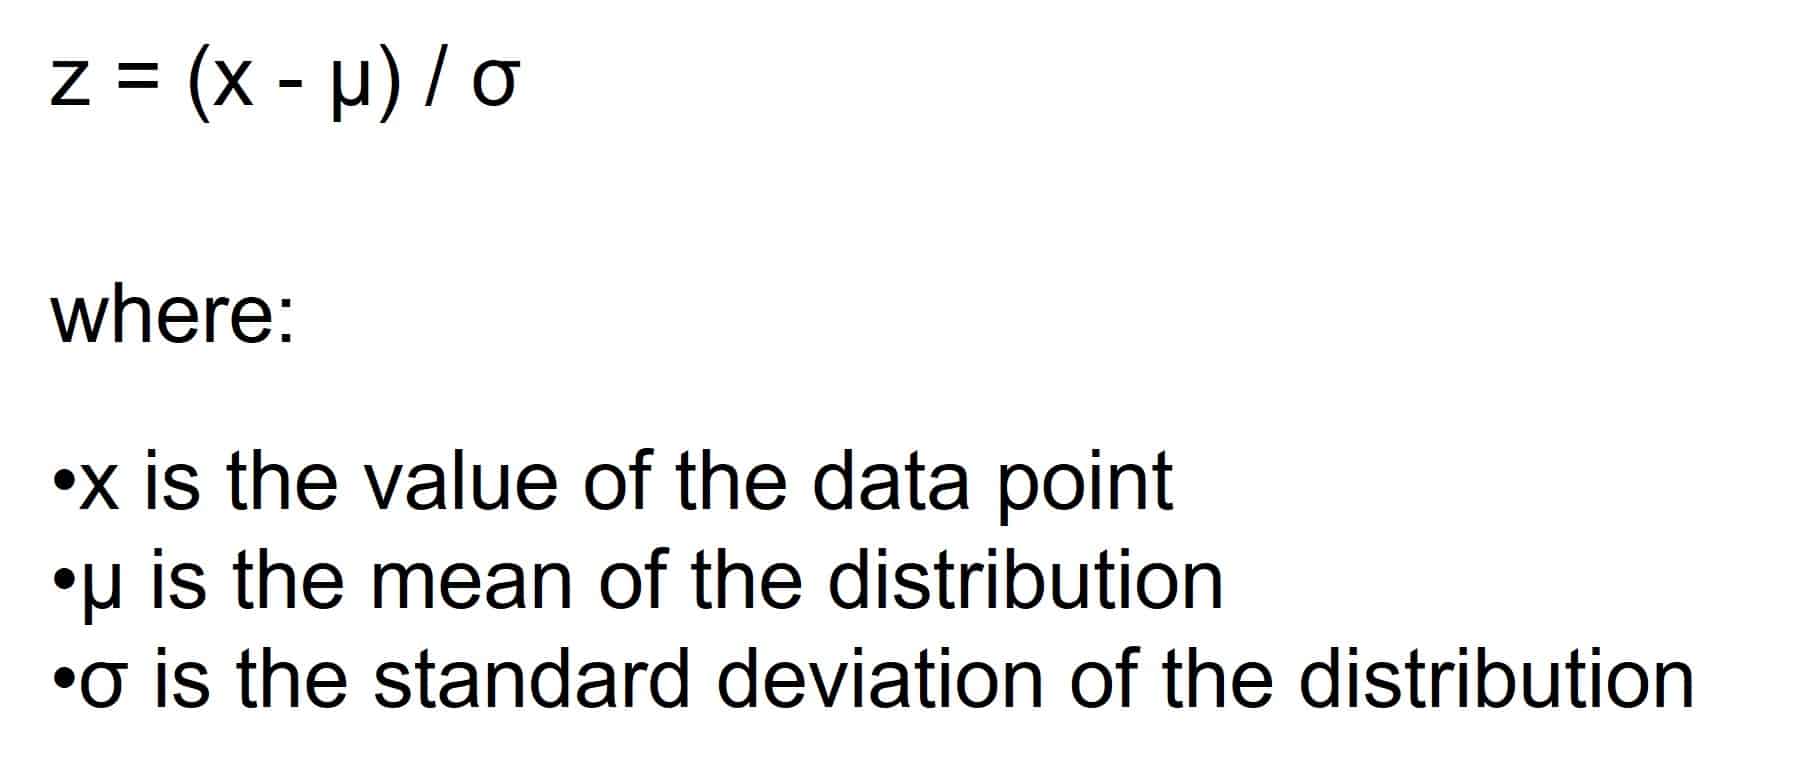
The z-score measures the number of standard deviations that a data point is above or below the mean of the distribution. It is calculated as:

The z-score can be used to compare values from different normal distributions, as it expresses each value in terms of its distance from the mean in units of standard deviation. It is also useful in identifying outliers or extreme values in a data set.
What Is Z-Score?
The z-score, or standardized score, is a useful statistical tool in many ways. Some of the benefits of using the z-score include:
Standardization
The z-score standardizes the data by converting it into a common scale. This allows for easy comparison between different datasets that have different means and standard deviations.
Normal Distribution
The z-score assumes that the data is normally distributed. This allows for statistical tests that rely on the normal distribution, such as hypothesis testing and estimations of confidence intervals.
Outlier Detection
The z-score is used to identify outliers in a dataset. Any data point with a z-score greater than 3 or less than -3 is considered an outlier.
Probability Calculations
The z-score can be used to calculate probabilities and percentiles for a given dataset. This is particularly useful in hypothesis testing, where you can calculate the probability of observing a given result by chance.
Data Transformation
The z-score can be used to transform a dataset into a standard normal distribution. This transformation can be useful in data analysis, as it simplifies the calculation of certain statistics and allows for easier interpretation of results.
Can Z-Score Be Used With Non-Normal Data?
No, you’ll need your data to fit along a normal distribution to make the best use of Z. While this might seem daunting at first glance, there are methods of transforming your data with minimal hassle. If you want to make full use of the Z-score, you might do well to use the Box-Cox transformation.
An Industry Example of Z-Score

Let’s assume you are analyzing the sales performance of a team of salespeople. The mean sales of the group are $75,000, and the standard deviation is $10,000. You want to know how well a particular salesperson performs relative to the rest of the team if their sales are $85,000.
To find out, you can calculate the z-score as:
z = (x – mu) / s.d where z = (85,000 – 75,000) / 10,000 or z = 1.
This means that the salesperson’s score is 1 standard deviation above the mean of the distribution. Since the standard deviation is $10,000, this translates to sales of $85,000 being $10,000 above the mean sales of the group.
You can interpret the z-score as follows: the salesperson’s sales are better than the sales of 84.13% of the sales team assuming a normal distribution. This can be found by looking up the z-score in a standard normal distribution table or using statistical software.
Other Useful Tools and Concepts
If you’re on the hunt for more statistical tools, you’re in luck. You might do well to learn all about Mood’s Median Test. You’ve got no shortage of tests at use when conducting your analysis, Mood’s Median Test is a great way of conducting non-parametric tests.
Additionally, you might need to learn about how key process input variables impact your production line. Processes are complex, especially in the context of modern production. As such, learning how these variables impact your data is going to be key going forward.