Key Points
- Z bench is a measurement for the number of standard deviations a point strays from the mean.
- It is similar in concept to the Sigma Shift, but different on the whole.
- Your Z score can clue you into how different processes are doing.
The term Z bench is a measure of process capability for continuous data. Before defining it, we will discuss the term Z score and then explain Z bench and its variations. Benefits and best practices will be presented along with an example of how to apply the concept of Z bench.
What Is Z Bench?
Before we go into an explanation of the Z bench, you should first understand what is meant by the letter Z. Assuming a standard normal distribution, Z or Z score is the number of standard deviations a value of interest would be from the mean.
The formula for calculating the Z score is:

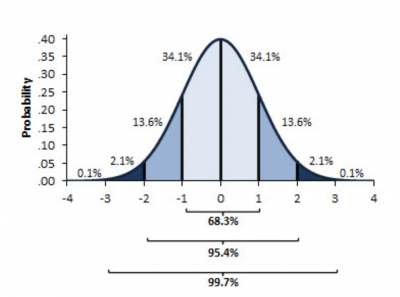
This graph represents the probabilities associated with the standard normal distribution and the standard deviations, or Z values.

Image source: Standard Normal Distribution
For example, let’s say your turnaround time is 190 minutes. Historically, turnaround time has a mean of 150 minutes and a standard deviation of 25 minutes. Assuming a normal distribution, your Z score would be:

The Z score is very useful because it can convert any continuous measurement into a generic measure, allowing comparisons between different processes.
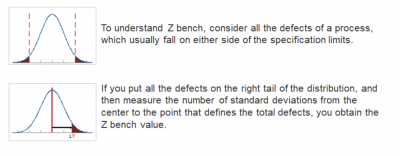
Z bench can be used as a measure of process capability and a substitute for Cp and Pp. Here are the various Z bench calculations you can do.


Image source: Z bench
The table below provides a comparison of the Z bench to other measures of process capability.

Image source: Z bench
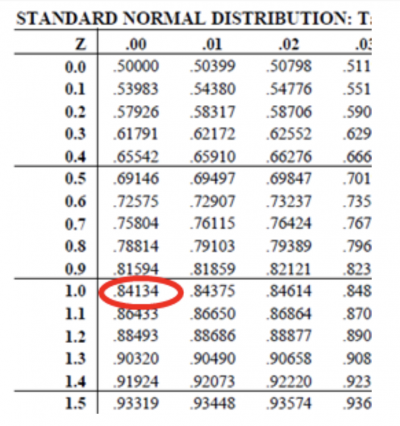
Looking at the standard normal table below, you will see that if you subtract the table value for a Z of 1.0 from 1, you get 1 – 0.84134 = 0.15866 x 1,000,000 = 158,660 DPM defective (defects per million). That is the value in the table above.

Finally, let’s have a brief discussion of the Z shift. This is a controversial topic where Z shift is defined as the difference between the long-term and short-term Z bench. Some practitioners, based on the work of Dr. Mikel Harry, assume this to be 1.5 standard deviations. There has been much debate on this topic, though.
Z Bench As a Metric
At its core, your Z score is nothing more than a generic measurement. It can translate to things like DPMO, Cpk, and Sigma. However, it is imperative to understand that it is more of a general means of quantifying how your data is straying. When preparing any sort of presentation to your upper brass, take the time to convert to a more suitable metric.
Benefits of Z Bench
Z bench has several benefits as a generic surrogate measurement for process capability.
Generic Measurement
Z bench is a generic measurement that converts different continuous data values into the number of standard deviations.
Simple Calculation
You only need a simple subtraction and division to calculate the Z bench.
Compares Different Processes
Z bench serves as a tool for comparisons between disparate processes. If process A has a higher Z bench than process B, you can say it is meeting specifications better than B. It doesn’t matter whether we are talking about “apple” or “orange” processes. The comparison is a relative measure of capability.
Why Is Z Bench Important to Understand?
Process capability, in any form, helps you determine whether your process is capable of meeting your customer’s specs, expectations, targets, goals, or any other measure of performance.
Short-term or Long-term
The calculations for short- and long-term Z bench are different. Knowing the difference in the standard deviations you will be using is important for the proper calculations.
What Your Customers Care About
The customer will be more interested in your ability to meet their specs in the long term. Short-term variation may be harder to control, so in the long run, you need to maintain your process consistency and capability.
Interpretation
Comparing different parts of your organization as a function of Z bench is an easy way to see who is meeting specific process specs and who isn’t.
An Industry Example
The incoming quality control manager was concerned about the current level of quality from one of its suppliers. Manufacturing had been complaining that the quality seemed to be slipping. Data was collected, and a process capability study was performed using the current specifications of 602 for the upper and 598 for the lower, with the expected mean to be 600.
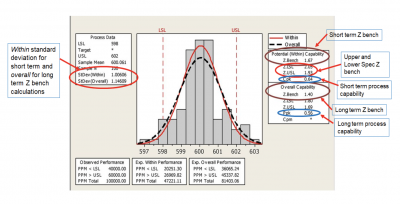
A popular statistical software package was used for the analysis shown below. You see the different Z bench and process capability calculations. This output is easy to interpret. Notice there appears to be a considerable amount of product beyond both the upper and lower specs. The Cpk (0.64) and Ppk (0.56) are less than one and far less than the company expectation of 1.67.
There appears to be more of an issue with violating the upper spec than the lower spec, as shown by the upper and lower Z bench values and the parts per million (PPM). A Z shift seems to exist as defined by the difference between Z bench short and long-term.
The bottom line is that manufacturing was correct: This supplier was doing a poor job in meeting the company’s specs. A meeting was set up with the supplier to go over the results of the study and to find solutions to immediately rectify the situation.

Image source: Minitab Example
Best Practices
Keep these few tips in mind when calculating and using Z bench to measure your process capability.
Use Z Shift, Not Sigma Shift
The original 1.5 sigma shift was an empirical calculation based on the experiences of Dr. Mikel Harry and Richard Shroeder. If you want to use sigma shift in your organization, use your actual long- and short-term values for Z bench.
Differences Between Short-term and Long-term Z Bench
A large difference in long- and short-term Z bench is interpreted as shifting and drifting of your process mean. This signifies an opportunity for process stabilization.
Convert Z Bench to DPMO
The concept of Z can be a bit esoteric for many managers. You should convert the Z bench numbers to DPMO or a similar measure for easier understanding.
Other Useful Tools and Concepts
Understanding how replicates can impact your DOE can show the effectiveness and stability of your processes. While we’ve discussed the measurements centering around process capability, there are many measures to see how effective and precise your production is. Paying attention to all of these components results in higher customer satisfaction.
Further, understanding the differences between breakthrough improvement and Kaizen is paramount for the process improvement cycle. At its core, these two approaches can appear quite similar. Deploying them is a different matter entirely, however.
Conclusion
Z measures the number of standard deviations a value is away from the process mean. It is based on the standard normal distribution. You can use various Z bench calculations to represent the Z value for just your upper spec, your lower spec, short-term, or long-term. Z bench can be used as another measure of process capability by substituting for Cp and Pp. Finally, it can be converted to DPMO (or similar value), which may be easier to understand.