Overview: What is a whisker?
We need to do a quick review of a box plot before discussing a whisker. The box plot, also referred to as a box and whiskers plot, was introduced in 1970 by American statistician, Dr. John Tukey.
A box plot consists of two parts, a box, and a set of whiskers. The lowest point is your minimum value of the data set, and the highest point is your maximum value of the data set. The box is drawn from its first quartile (Q1 or 25th percentile) to its third quartile (Q3 or 75th percentile) and contains 50% of your data. A horizontal line drawn in the middle of the box represents the median of your data set.
The whiskers consist of two lines extending out from the box and represent the range of the data. How far they extend is a function of the calculation of a factor known as 1.5IQR (1.5 multiplied by IQR) where IQR is defined as the interquartile range. This is the difference between the values of the Q3 and Q1 data points.
If the maximum value is less than the 1.5IQR calculation, then the whisker represents the actual maximum value. If the maximum value is greater than the 1.5IQR calculation then the whisker is located at the value of 1.5IQR and any data points falling above the whisker are identified as outliers.
An industry example of a whisker
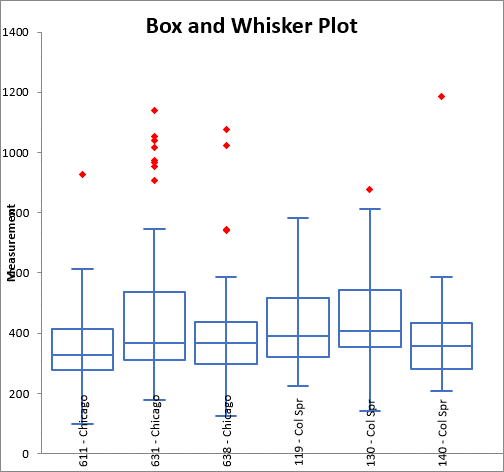
The regional vice president of a chain of fast-food restaurants wanted to compare kitchen preparation time for his six stores. He used a box plot to visually compare the stores. He was able to raise some questions about what he saw and why there were differences between his six stores. This is the output from his statistical software:

Frequently Asked Questions (FAQ) about a whisker
How does the term 1.5IQR relate to a box plot whisker?
The length of the whisker on your box plot will be based either on the maximum value of your data set or the value calculated by multiplying 1.5 times the IQR or interquartile range.
Can I have data points beyond 1.5IQR?
Yes. If some of your values were higher than 1.5IQR those points would be considered outliers. If your maximum value is less than 1.5IQR then that is the length of your whisker and there won’t be any outliers.
In a box plot, will the length of my whiskers be the same?
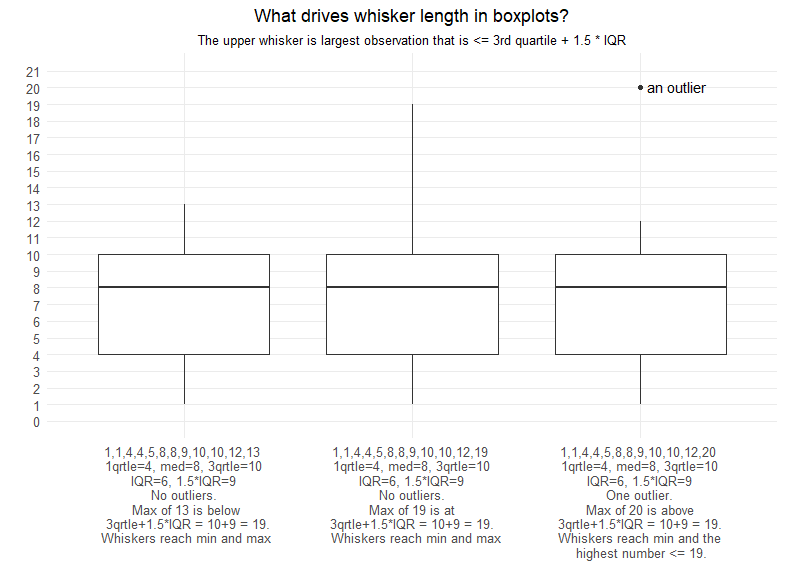
Not necessarily. The graph below shows three examples where the length of whiskers may vary:
