Many statistical tools have an assumption of normality. Is there an option if my data is not normal? Transforming your data might help.
Some statistical methods, such as hypothesis testing, have an underlying assumption of normality of your data before they can be used. Although control charts are generally robust to normality issues, sometimes the data is sufficiently non-normal that it might make sense to transform your data as a last resort.
Before using a data transformation, you should try to get a better understanding of your data and why it might be non-normal. Here are some suggestions:
- Stratify your data
- Eliminate obvious outliers
- Use non-parametrics
If all else fails, then consider doing a data transformation.
Overview: What are transformations?
There are two common techniques used for transforming data. One is the Johnson Transformation and the other is the Box-Cox Transformation.
The Box-Cox transformation is a useful family of transformations. It is defined as:

where Y is the response variable and lambda is the transformation parameter. The Box-Cox normality plot is a plot of correlation coefficients for various values of the lambda parameter. The value of lambda corresponding to the maximum correlation on the plot is then the optimal choice for lambda.
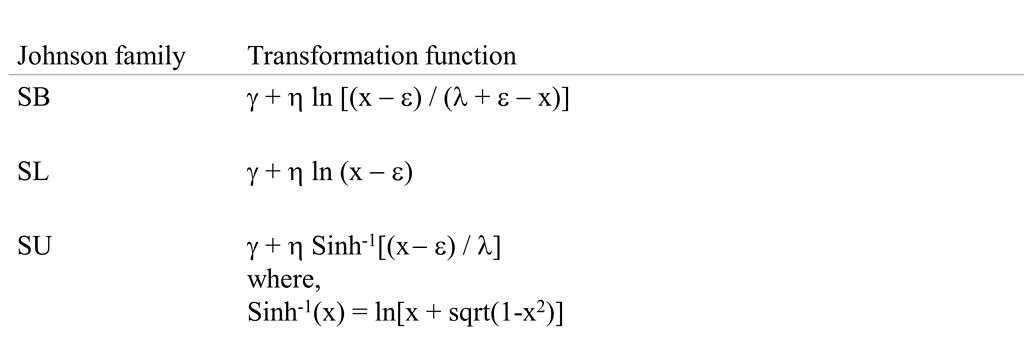
The Johnson Transformation optimally selects one of the three families of distribution: SB, SL, and SU, where B, L, and U refer to the variable being bounded, lognormal, and unbounded respectively. The selected distribution function is then used to transform the data to follow a normal distribution. Here are the transformation formulas for the three distribution families:

An industry example of a transformation
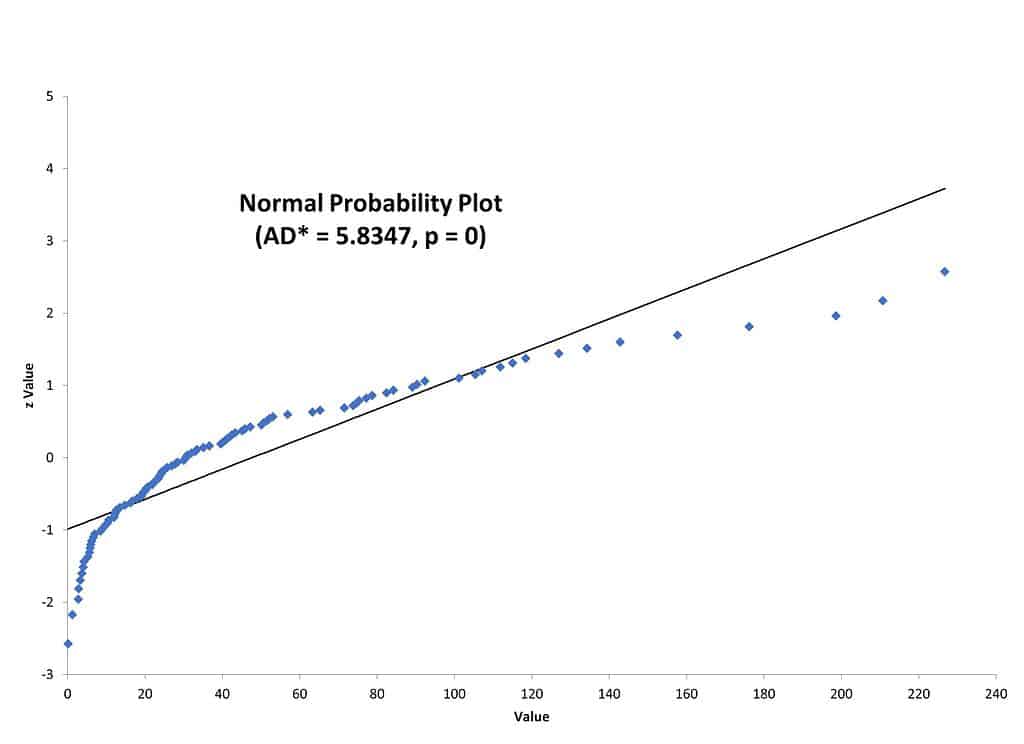
The company’s Master Black Belt (MBB) collected some setup time data and wanted to do some hypothesis testing. One of the underlying assumptions was that the data was normally distributed. The probability plot below shows that the data is not normal.

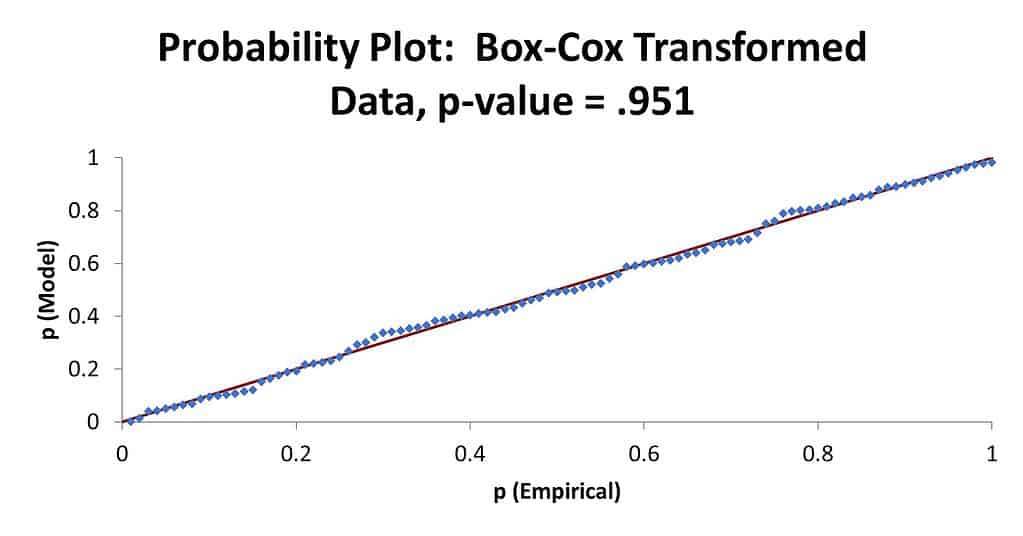
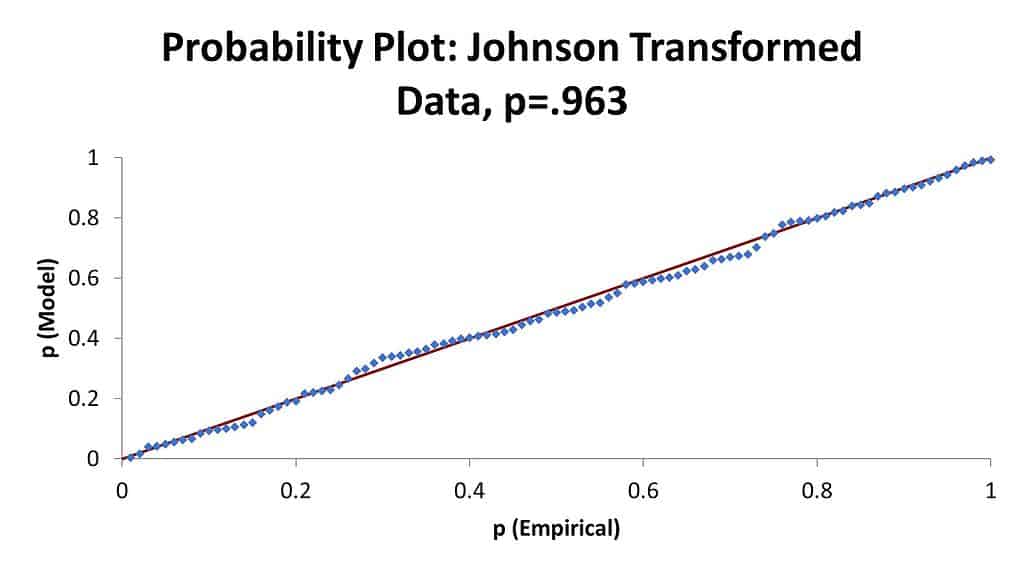
The p-value of zero and the points not falling on the straight line indicate the data is not normally distributed. The MBB then decided to try doing a data transformation on the same data. Here is what the Box-Cox and Johnson Transformations look like on a probability plot.


Note that the points are now almost all on the straight line and the p-values are very high. The MBB can now use this transformed data to draw to do his analysis.
Frequently Asked Questions (FAQ) about transformations
Why do I need to do a data transformation?
If you want to use a statistical tool which has an underlying assumption about a specific distribution and your data does not follow that distribution, you may want to first do a data transformation.
Are there any watch outs when using data transformations?
The major downside to doing a data transformation is that the transformed data is not the same as the original data. If you publish or distribute your analysis in terms of transformed data, your audience may be confused since the number values and format may not make sense to them. Therefore, it is suggested you use the transformed data for your analysis but only provide the conclusions to your analysis and not display the transformed values.
Can you provide a simple example of a transformation?
Let’s assume you are taking a trip from the U.S. to Europe. Your U.S. dollar is ok in the U.S. but the major currency in Europe is the Euro. Before you leave, you transform your $500 USD into an equivalent value in Euros. Now you can use your transformed money to buy things in Europe. On the way back to the U.S. you may stop at a currency exchange and, this time, you will do a back transformation where you convert your transformed EU currency back to your original USD money.