Statistics is a branch of math that involves the collection, description, analysis, and inference of conclusions from quantitative data. But what is a statistic? Let’s find out.
The word statistic is a word with numerous possible definitions. In its simplest form, a statistic can be defined as a descriptor of a set of data. The data you collect can be defined as either population data or sample data. The descriptors of data include its central tendency and dispersion or variation.
Overview: What Is a Statistic?
Strictly speaking, you can define the characteristics of population data or sample data. The descriptors of population data are referred to as population parameters. When it is not feasible to directly measure the value of a population parameter, statistical methods are used to infer the likely value of the parameter based on a statistic computed from a sample taken from the population.
The descriptor of sample data is referred to as a sample statistic. When a sample statistic is used for estimating a population parameter, the statistic is called an estimator. A descriptive statistic is used to summarize sample data. A test statistic is used in statistical hypothesis testing.
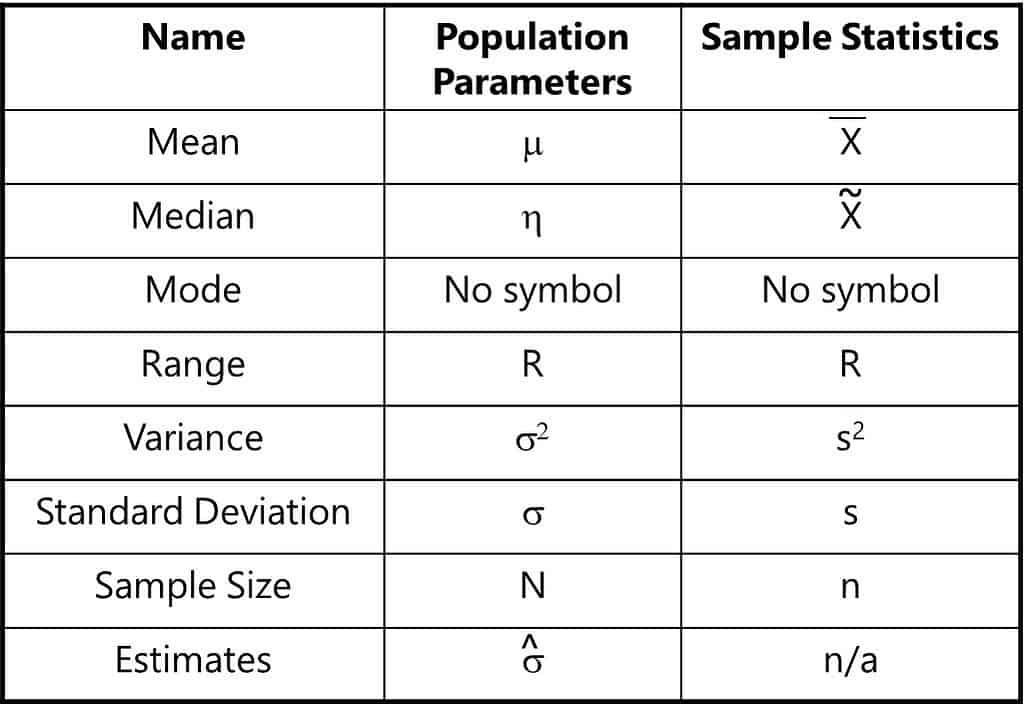
Here is a table describing both population parameters and sample statistics and their relevant symbols. Note that population parameter symbols are generally Greek letters.

An Industry Example of a Statistic
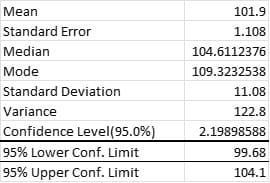
The company’s statistician did some analysis and descriptive statistics of company sample data shown below.

He was able to use the sample statistics to estimate the population parameter for the mean. By adding and subtracting the value for the Confidence Level (2.199) he computed a confidence interval of 99.68 – 104.1 as the estimate of the mean of the population parameter.
Why It’s Important
Statistics are the cornerstone of any aspect of an organization. This is especially true if you’re an adherent to the likes of Lean Six Sigma or Six Sigma methodology as a whole. These are data-driven approaches, and understanding how to interpret those data points is fundamental.
Other Useful Tools and Concepts
So, how do statistics apply across the board? Why not look at Exponentially Weighted Moving Averages to see the power of the math in your current data? EWMA is a slightly headier concept but is crucial if you’ve got processes that are constantly evolving.
Further, you might want to read up on VOC, or the voice of the customer. This concept is just one of many voices you need to heed while developing a deliverable. Understanding how it relates to your data and end products is a recipe for success.
Conclusion
While this is a brief guide, you hopefully come away with it understanding the concepts behind statistics more firmly. Statistics are a crucial part of any organization, and you’ll often find their application comes in many different forms. Getting to grips with how it works will help your organization perform to its maximum potential, however.