
Key Points
- Sigma represents the population standard deviation for a data set
- Sigma is used to measure process capability in Six Sigma
- Careful application of Sigma can aid in diminishing DPMO in the production line.
- Six Sigma is six standard deviations from the mean of a data set
- The application of Sigma in statistical analysis allows for fast calculation of standard deviations.
The meaning of Sigma in statistical analysis is a function of whether you use the upper or lower case of the letter. The uppercase use of sigma denotes a summation while the lowercase represents a measure of variation.
Overview: How Is Sigma Used in Statistical Analysis?
Below are the uppercase and lowercase symbols for sigma:

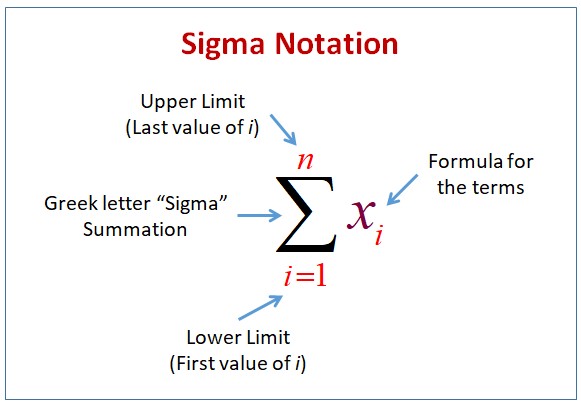
When used in the uppercase, it indicates a summation of values as shown below:
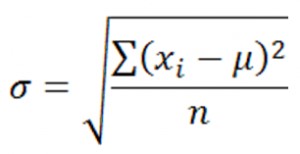
A lowercase Sigma signifies and represents the population standard deviation of a set of quantitative data. Interestingly, the formula for the standard deviation includes the uppercase notation of Sigma. See the formula below:
Lowercase Sigma is also referred to in the context of Six Sigma. In this case, it is a measure of process capability The term Six Sigma means that the closest specification of a process or product is six standard deviations away from the mean of a normally distributed set of data. This capability is defined as having only 3.4 defects per one million opportunities often referred to as 3.4 parts per million (ppm).
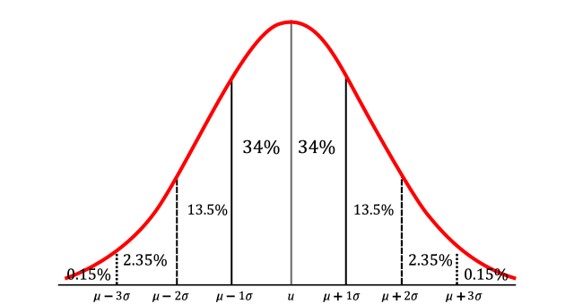
Another use of lowercase sigma is in the Empirical Rule, which describes the distribution of data in a normal distribution. When adding and subtracting various numbers of standard deviations from the mean, you will encompass different percentages of the total data set. Below is a graphic of the Empirical Rule.
An Example of Sigma in Statistical Analysis
Here are a few examples of how sigma can be used in statistical calculations.

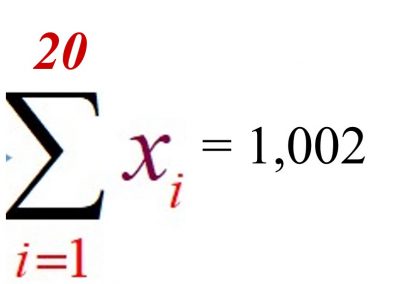
If I wanted to add up the numbers above, I would use the following format of sigma:
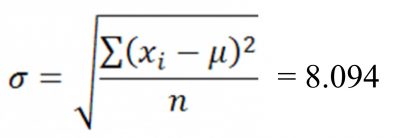
Assuming the data set was the population data, I would use the following format of sigma for calculating the population standard deviation:
How Sigma in Statistical Analysis Streamlines Production

Often, when discussing Sigma in statistical analysis, it is related to Sigma Levels seen in the analysis stage of production. Generally speaking, we’re looking at Sigma Levels and how they relate to DPMO or defects per million opportunities.
The Sigma Level of a given process affects the defects found, with a Sigma Level of 1 being the worst possible outcome for an organization’s workflow. Ideally, you should strive for a Sigma Level of 6. This is the absolute nadir of production, yielding near-perfect deliverables in the production pipeline.
Other Statistical Analysis Tools to Keep in Mind
What makes the Six Sigma methodology great is the variety of tools on hand to help make your organization more productive. If you’re looking for effective ways of handling root-cause analysis, you might want to read up on the 6W Methodology.
Of course, given how Sigma in statistical analysis applies to production, you’ll likely need some additional tools for statistical analysis. Understanding how the normal distribution relates to a given Sigma Level is crucial.
Conclusion
On its own, Sigma in statistical analysis is a tool. However, understanding how to calculate the Sigma of a given population has benefits seen beyond just the scope of statistical analysis. After all, this basic calculation is the cornerstone of the entire Six Sigma methodology. Learn how to apply this to your production workflow, and you’ll see incredible results.