The purpose of doing simple linear regression is to help predict a Y output variable based on your X input variables. But, as in all statistical analysis, there will be some error. Residuals are the errors associated with your regression predictions.
Let’s explore this some more.
Overview: What is a residual?
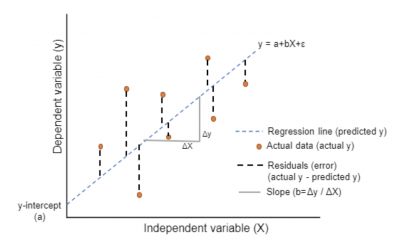
A residual is the vertical distance from the prediction line to the actual plotted data point for the paired X and Y data values. The residual is the error associated with the prediction line. The fitted line plot below illustrates this.

Fitted line plot and residuals
Since the residuals are actual number values, they can also be plotted. The residuals plot should conform to certain assumptions and will tell you about the validity of your regression. If you severely violate the assumptions, you need to go back and evaluate your regression model.
The assumptions are:
- Residuals should be normally distributed around a mean of zero
- Residuals should have a constant variance
- Residuals should be uncorrelated with each other
- Residuals should be independent of the order of the data
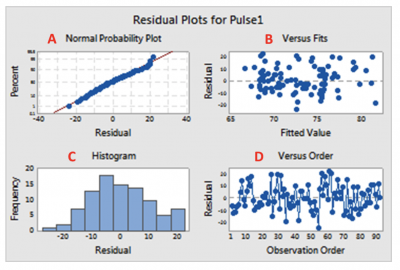
Here is what a residuals plot would look like:

- Probability plot shows whether the residuals are normally distributed. Points should be in a straight line.
- This plot should be random around zero to show constant variance.
- The histogram will let you know if you have any outliers.
- Points should be random around zero to show residuals are not affected by the order in which the data was collected and, thus, are not correlated.
An industry example of residuals
The lab manager at a major pharmaceutical company was interested in whether there was a relationship between the potency of one of their liquid drugs and time. Data was collected and a regression analysis was done.
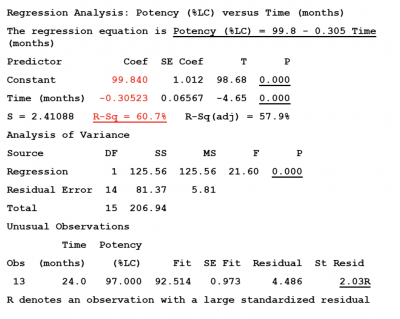
Below is the analysis of the data.

The R-sq value of 60.7% indicates a relatively strong correlation between potency and time. The prediction equation is Potency % = 99.84 – 0.30523X, where X is the number of months you wish to predict potency for.
The company’s Six Sigma Black Belt reminded the lab manager that you can’t accept the regression without analyzing the residuals.
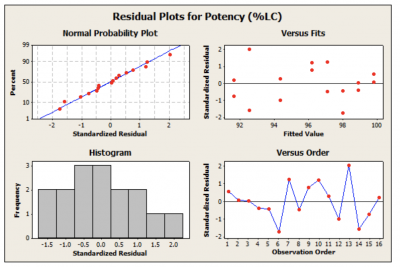
They looked like this:

The normal probability plot indicates the residuals are normally distributed around zero. The residuals versus fits appear to be random around zero, meaning the variance is constant. The histogram showed no outliers. The residuals versus order is random around zero, showing the residuals are uncorrelated.
Since all the assumptions of the residuals were met, the regression model can be considered valid.
Frequently Asked Questions (FAQ) about residuals
How are residuals computed?
It is the vertical difference between the prediction line value and the actual data point.
What do the residuals tell you?
They tell you the degree of error you have in your prediction equation. An analysis of the residuals and their accompanying graphs will indicate the validity of your regression model.
Are there any assumptions regarding the residuals when doing regression?
Yes. The primary assumptions are:
- The residuals should be normally distributed around a mean of zero
- The variance of the residuals should be constant and the plot of the residuals versus fits should be random around zero
- The residuals should be uncorrelated with each other.