© Ground Picture/Shutterstock.com
Key Points
- A platykurtic distribution resembles a normal distribution, with some differences.
- Typically, a platykurtic distribution has a shorter center with fewer values distributed along the ends.
- Platykurtic distributions can affect plans for statistical analysis.
Many statistical tools have an underlying assumption your data will be normal. But, what if your data distribution looks different from the standard normal curve, what does that mean?
Overview: What Is a Platykurtic Distribution?
Kurtosis is one of the key measures used for describing the shape of the normal distribution. Kurtosis is a measure of the height of your data distribution and the length of the tails relative to normal distribution. Kurtosis refers to the tailedness of the distribution rather than the peakedness. The value for kurtosis of a normal distribution is 3, and the shape is referred to as mesokurtic. Kurtosis for a standard normal distribution will be zero.
Leptokurtic describes a distribution where the value for kurtosis is greater than 3 when compared to a normal distribution and a value larger than zero when compared to a standard normal distribution.
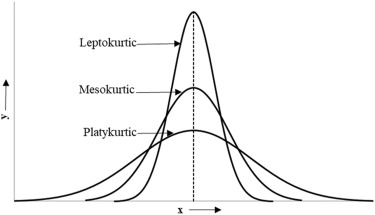
Platykuritc describes a distribution where the center of the curve will be shorter than a normal or mesokurtic distribution, and the tails will be lighter with fewer values in the tail. Below is a graph comparing a normal distribution with a platykurtic and leptokurtic one. Note the lower tails for the platykurtic distribution.
Defining a Platykurtic Distribution
As you can see a platykurtic distribution is shorter and wider compared to its counterparts. The quickest way to determine if your distribution is platykurtic is by looking at the kurtosis of a distribution. If the kurtosis itself is 3 or lower, you’ve got a platykurtic distribution.
An Industry Example of a Platykurtic Distribution
The company Black Belt (BB) was reviewing the graphical output of her data to see if it was normally distributed so she could easily do the needed statistical calculations. Unfortunately, the shape of her data was platykurtic.
Her interpretation was the data had less outliers than a normal distribution due to the thinner and shorter tails. She was concerned the outliers might impact the validity of her analysis.
Below is a graph of some normally distributed process data plus a graph of data that appears to be platykurtic. Note the value of kurtosis with the normal distribution is close to 0 and the platykurtic value is negative.


Other Useful Tools and Concepts
Looking for other ways to aid your organization? Speaking of variations and distributions, you might not have a firm grasp on special cause variations. These are sudden and chaotic factors that disrupt production. Learning how to account for and compensate for them should be paramount for any business.
Additionally, you’ll likely want to take a look at Kaizen Events. These are fast-paced, short-duration workshops aimed at opening lines of communication between all staff while implementing process changes.
The image featured at the top of this post is ©Ground Picture/Shutterstock.com.
