When faced with multiple predictor or independent variables, your goal is to develop the best prediction model with the least amount of variables. Mallows’ Cp is one of the calculations you look at to help develop your best model.
Overview: What is Mallows Cp?
Best Subsets is a statistical technique which compares all possible multiple regression models for a set of predictor variables. The output displays the best-fitting models containing one predictor, two predictors, and so on. The result is a number of possible regression models and their summary statistics. Mallows’ Cp helps you choose between these multiple regression models.
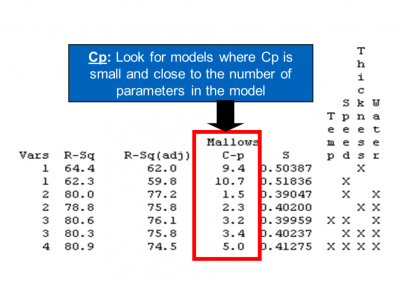
Usually, you should look for models where Mallows’ Cp is small and close to the number of predictors in the model plus the constant (p). A small Mallows’ Cp value indicates the model has small variance in estimating the true regression coefficients and predicting future responses. A Mallows’ Cp value close to the number of predictors plus the constant indicates the model is relatively unbiased in estimating the true regression coefficients and predicting future responses. Models with poor fit will have larger values of Mallows’ Cp exceeding the predictor variables plus the constant.
The formula for Cp is:

An industry example of Mallows Cp
An engineer was seeking to develop a regression model to predict the amount of coating applied to a base component during processing. The independent variables were speed of the line, temperature of the coating material, thickness of the application and amount of water.
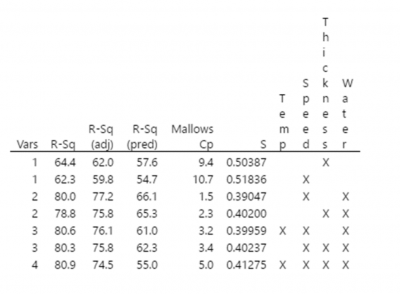
He decided to use Best Subsets to compare the possible models and find the most optimal one. Here is some of the output from the Best Subsets method. Which do you think is his best model?


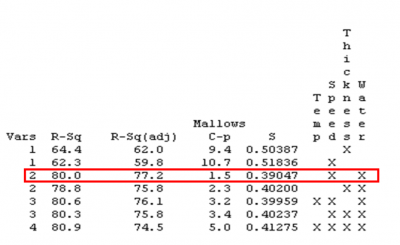
The best model would include Speed and Water as the predictor variables. Since the Rsquare Adjusted is the highest and the Mallows’ Cp of 1.5 is smaller than the number of variables (2) plus the constant we would choose this model.
Frequently Asked Questions (FAQ) about Mallows Cp
1. What is a good value for Mallows’ Cp?
A Mallows’ Cp value close to the number of predictors plus the constant, indicates the model produces relatively precise and unbiased estimates for the response variable.
2. What is the Best Subsets regression method?
The Best Subset method aims to find the subset of independent variables which provide the best prediction of the outcome or response variable. It does this by considering all possible combinations of the independent variables. Mallows’ Cp is one of the statistics provided in most statistical software which have a Best Subsets function.
3. Is there another statistic I should look at, beside Mallows’ Cp, to help pick my best model?
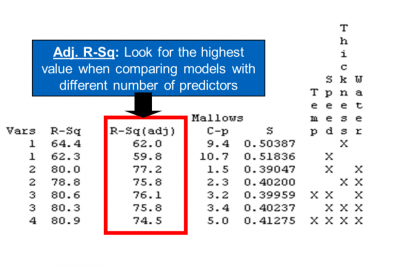
The output from most statistical software will provide an Rsq Adjusted value in addition to the Mallows’ Cp. The Rsq Adjusted value measures how much of the variation in the response variable is explained by your regression model. The closer Mallows’ Cp is to the number of variables in the model plus the constant and the higher the Rsq Adjusted, the better the model will be.