Once you have sample data, you can take two approaches to understanding what information your data can provide. One approach is to use descriptive statistics to describe certain characteristics of your sample data. The other approach is to use inferential statistics. This allows you to make generalized inferences about the population from which you collected your sample data.
Overview: What are inferential statistics?
Descriptive statistics allow you to describe certain aspects of your data. They are typically used to describe the central tendency (mean, median, mode), variation (range, variance, standard deviation), and shape of your data or distribution (normal, Poisson, binomial). There is no probability associated with descriptive statistics since it precisely describes the sample data.
In many cases, you aren’t particularly interested in what your sample data says, but how you can use it to make predictions, generalizations or inferences about the population where the sample data came from. For example, you tested the efficacy of a drug on 100 patients. Descriptive statistics will tell you about the effect on those 100 people. But, if you are planning on selling it to thousands of patients, you would want to predict how it would work for them, not just the 100 in your test group.
Inferential statistics use the information from your sample data to make estimates and hypotheses about the population. Random and unbiased sample data is necessary to make statistically valid inferences. Since you are using samples, there will always be some sampling error in your inferences. This error occurs when using sample statistics to make statements about population parameters.
There are two main areas of inferential statistics:
1. Estimating parameters
This means using a sample statistic to say something about a population parameter. This is often done as an interval estimate which gives you a range of plausible values where the parameter is expected to fall. A confidence interval is the most common type of interval estimate.
2. Hypothesis tests
The purpose of hypothesis testing is to compare populations or assess relationships between variables using samples.
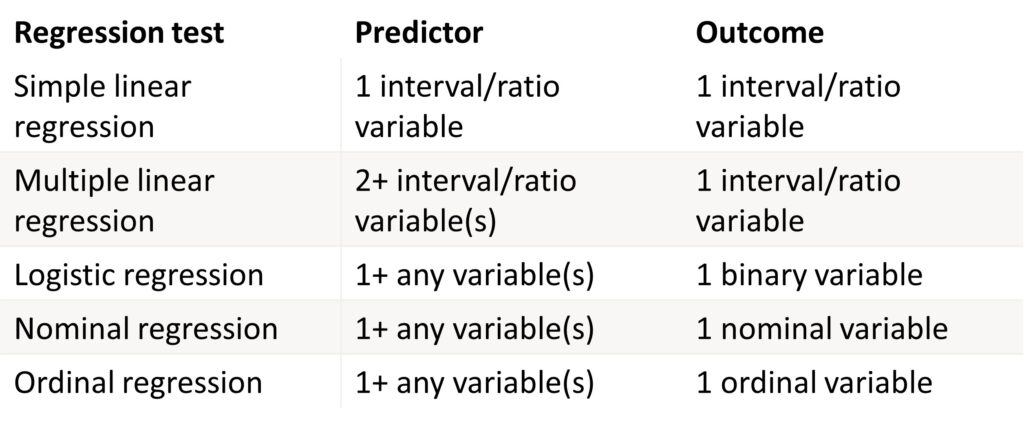
There are three types of statistical tests which use inferential statistics; comparison, correlation and regression. Here are some details on all three:

Inferential tests for comparison

Inferential tests for correlation

Inferential tests for regression
An industry example of inferential statistics
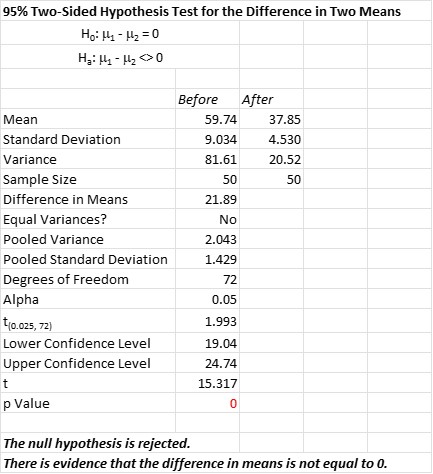
A common inferential statistical test is the 2-sample t-test. This is done when you have two sample data sets and want to compare the means of the two data sets and whether they came from the same population. As in all hypothesis tests, you will have a null (Ho), and alternative hypothesis (Ha). In this case, the null is that the two population means are statistically the same, and the alternative is that they are different.
Below is the output of a statistical software package for comparing the means before and after a change was made in the process.

Note that the p-value is 0 so you can be comfortable rejecting the null hypothesis, accepting the alternative hypothesis, and stating there is a statistical difference between the before and after populations. Also note that the Ho and Ha are written to compare the population means, and not the sample means.
Frequently Asked Questions (FAQ) about inferential statistics
What is the difference between descriptive and inferential statistics?
Descriptive statistics is used to describe specific characteristics of a sample set of data. Inferential statistics uses sample data to make predictions or inferences about the population from which the sample data came from.
What are the three types of hypothesis tests?
Hypothesis tests can be used for comparison (t-test, ANOVA), correlation (Pearson’s r, Chi Square), and regression (simple linear, logistic).
What kind of error can I have when using inferential statistics?
The most common error you will encounter when using inferential statistics is sampling error. Since you are using a sample or subset of the population and then trying to make inferences about that population, you will incur an error influenced by the size of your sample, level of desired confidence and amount of variation in your sample.