When you think about the GLM, you can also think about multiple linear regression and analysis of variance (ANOVA). This article will explore how to use the GLM, when it is appropriate to use, some of the benefits and best practices of using the GLM, and how to apply it in your organization.
Overview: What is the GLM?
The term general linear model (GLM) usually refers to conventional linear regression models consisting of a continuous response, or dependent variable (Y), and continuous and/or categorical predictors, or independent variables (X). GLM includes multiple linear regression, as well as ANOVA.
One of the underlying assumptions of multiple linear regression is there is a matched pair of X and Y values. This means for each measured X value, there is a corresponding Y value. But that may not always be the case. If so, can you still develop a relationship and a prediction equation? Yes, that is the purpose of the GLM.
But first, let’s define some terminology.
- Cell: A combination of factor levels
- Full Rank: Implies no empty cells
- Balanced: Each cell has the same number of replicates
- Full-rank but unbalanced: Number of replicates is different for at least one cell but no cells have zero replicates
- Less than full rank and unbalanced: Less than full rank because you have an empty cell, and unbalanced because you do not have an equal number of replicates.
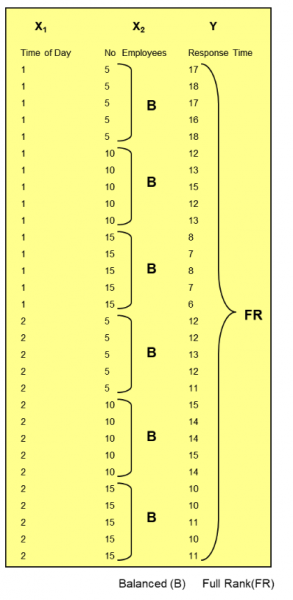
This is what the data sets would look like for the different definitions. The scenario for this data is:
- Response Time is the average response time of a call in a call center
- Time of day for the call is either a.m. (1) or p.m. (2)
- No Employees is the number of employees working that day (5, 10, or 15)
The data set below demonstrates full rank and balanced:

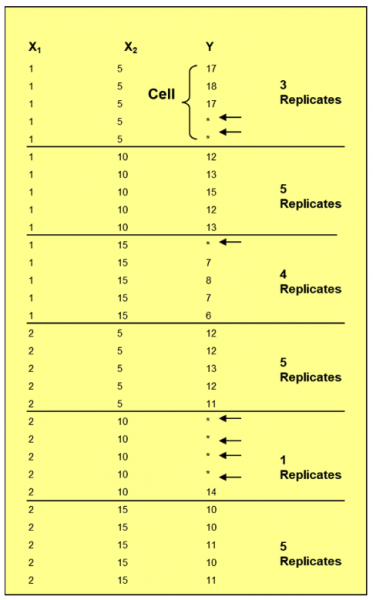
Next you have full rank but unbalanced because you have at least one replicate for each cell, but it is unbalanced because you do not have an equal number of replicates.

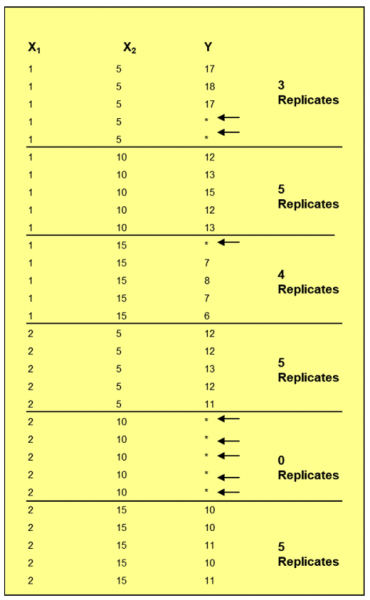
Finally, you can see an example of a less than full rank and unbalanced. It is less than full rank because you have an empty cell, and it is unbalanced because you do not have an equal number of replicates.
Unless it is full rank, you cannot analyze interactions between your Xs.

If your data is full rank and balanced, you would use ANOVA to analyze your data. If your data was full rank but unbalanced, you would use GLM.
Below is the output of this example showing the number of employees to be significant as well as the interaction between time and employee:

Here are some thoughts about using ANOVA versus GLM.
- Full rank & balanced: Use ANOVA
- If less than full rank and/or unbalanced: Use GLM
- You need full rank to look at interactions
- If you have more than two factors: Use GLM
3 benefits of using the GLM
Sometimes you are unable to collect all the data you need to do a complete regression analysis. GLM provides some benefits when you are faced with that situation.
1. Allows for missing data
GLM allows you to account for missing data if you wish to establish relationships between your Xs and Y.
2. Available in most statistical software packages
Since the hand calculations for doing GLM can get a bit tricky, most of the well-known statistical software packages have a GLM functionality.
3. Interpretation
GLM is relatively easy to interpret and allows a clear understanding of how each of the predictor variables are correlated with the response variable.
Why is GLM important to understand?
The flexibility of using the GLM makes it important to understand how and when to use it.
Distribution of response
The GLM is a generalization of the common linear model. GLM allows the dependent variable to be generated by any distribution belonging to the exponential family. Therefore, GLM constitutes a general framework to handle different types of relationships.
Understanding the output
The GLM output will provide the coefficients for your various predictor variables so you can have a prediction equation. It will show which, if any, of the predictor variables have a significant relationship with your response variable. Be careful that your predictor variables are not correlated with each other. You may have to test for multicollinearity.
Impact of outliers
Techniques such as Cook’s Distance should be used to understand the influence that outliers may have on your prediction equation.
An industry example of GLM
The sales manager for a car dealership wanted to better predict how much a salesperson might sell as a function of how long they spend with a potential customer and their level of experience.
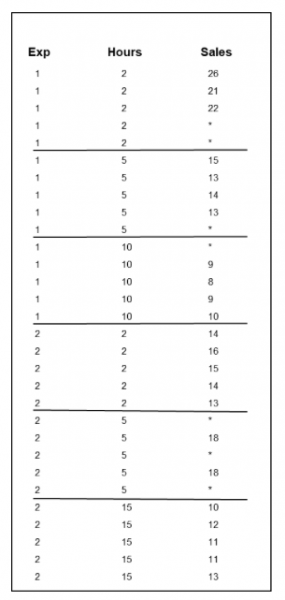
He used total hours (2, 5, or 10) as a predictor variable along with experience categorized into two levels: more than 5 years of car sales experience (1) and 5 years or less of experience (2).
Here is the data sheet:

Unfortunately, as you can see, the sales manager was not able to get all the information he wanted. His finance analyst suggested he use a General Linear Model approach rather than a traditional regression and ANOVA one. Given the missing information, the data was judged to be full rank but unbalanced.
Below is the computer output.

The above can be interpreted as hours spent with the customer alone is not a statistically significant predictor of sales (p-value of 0.46), but experience is (p-value of 0). There is also a significant interaction (p-value of 0) between hours and experience, meaning sales can be predicted depending on the unique combination of hours and experience.
3 best practices when thinking about GLM
Here are a few tips to help you make optimal use of GLM.
1. Carefully collect your data
If possible, try to get balanced and full rank data so you can use ANOVA.
2. Use visual information
Use Main Effects and Interactions plots to get a quick visual look and directional indicator.
3. Reduce the number of terms if necessary
If you get an error message that says rank deficiency, you do not have enough data to model the terms you have chosen. Try to eliminate terms.
Frequently Asked Questions (FAQ) about GLM
What is GLM used for?
GLM is a generalized form of ANOVA and linear regression. It is used to predict the outcome of a response variable as a function of one or more predictor variables.
When would I use GLM instead of ANOVA?
If you have full rank and balanced data, you should use ANOVA. If your data is less than full rank or unbalanced, use GLM.
Does my data have to be normal to use GLM?
No. In any kind of regression, normality will refer to the distribution of residuals, not the raw data.
Final wrap-up of GLM
GLM is a general form of regression and ANOVA. It is useful in situations where you don’t have full data for all the possible combinations of your paired predictor and response variables. The three basic forms are referred to as:
- Full rank and balanced – use ANOVA
- Full rank and unbalanced – use GLM with interactions
- Less than full rank and unbalanced – use GLM but no interactions