Key Points
- Flowcharts are a great means of visualizing projects, processes, and more.
- Using standard symbols can increase the readability of your flowcharts.
- SIPOC and Value Stream Maps are popular examples of a flowchart.
A flowchart is a diagram of a process, using standard symbols to represent a variety of process activities over a specified timeline. Frank and Lillian Gilbreth introduced the “flow process chart” in their 1921 presentation to the American Society of Mechanical Engineers (ASME).
The presentation was entitled “Process Charts: First Steps in Finding the One Best Way to Do Work”. It later was introduced into many core industrial engineering curricula.
What Is a Flowchart?
Some of the advantages of using such charts to describe your process are:
- Builds clarity
- Helps identify specific steps
- Outlines a complex process
- Communicates ideas quickly
- Coordinates team effort
- Increases efficiency and exposes inefficient areas
- Creates clear documentation
- Helps solve problems
Some of the disadvantages are:
- They take time to create. If you are flowcharting a process that isn’t complex or is very short, making a flowchart might end up being a waste of time and resources.
- Doesn’t account for unusual activities. The linear nature of a flowchart limits its ability to capture unique actions.
- If the process is not stable, frequent edits to a flowchart might not make it worthwhile.
RELATED: FLOWCHART VS. PROCESS MAP
There are several diagrams which are referred to as flowcharts. Some of them are:
- SIPOC – Supplier, Input, Process, Output, Customer
- Swimlane chart
- Value stream map
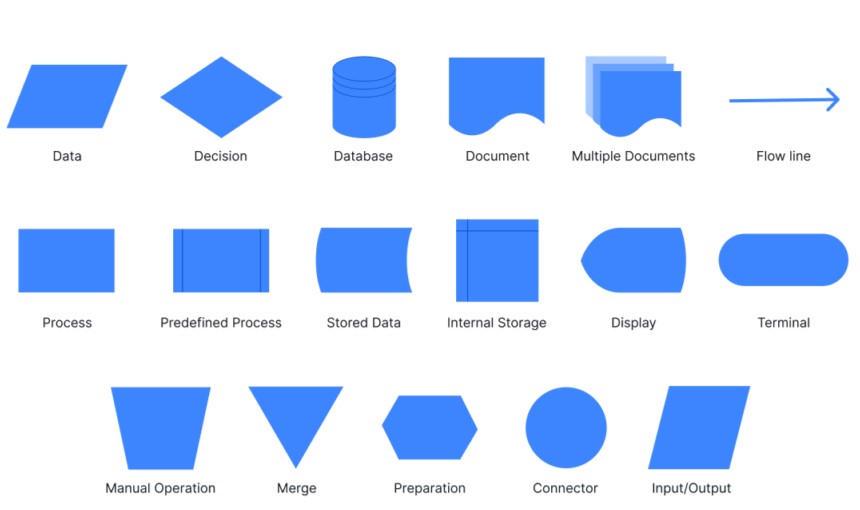
There are some common symbols which are used when constructing a flowchart. These are:

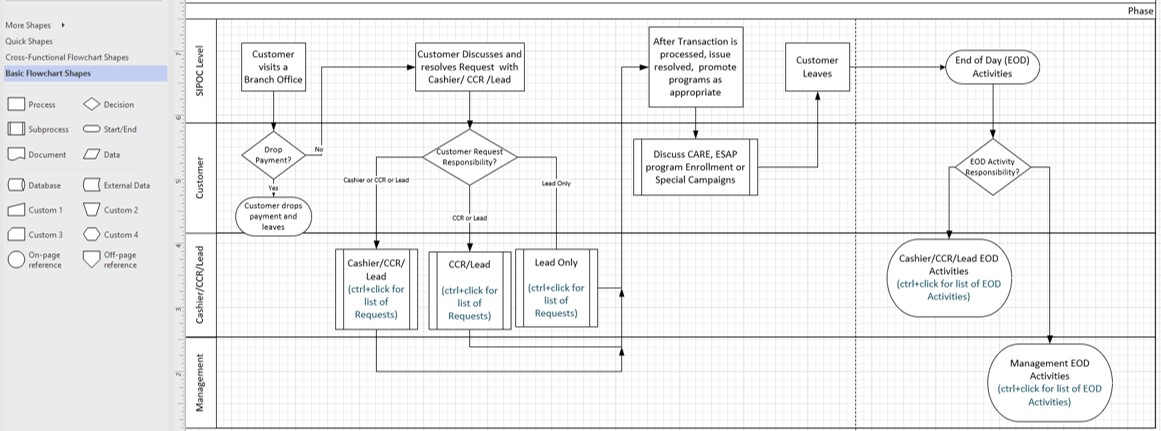
While there are several software programs for creating flowcharts, Microsoft Visio is one of the more common. Below is an example of how one looks. Note, that the functional work areas are listed on the left which is how a Swimlane diagram is constructed.

Why Should You Consider One?
So, why think about using a flowchart in the first place? When it comes time to draft out processes or projects, you want your team on the same page. This is where a flowchart shines. It allows you to clearly define the scope and breadth of a project while keeping everyone on the same page. If you’re using standardized symbols, there is little left to interpretation.
An Industry Example
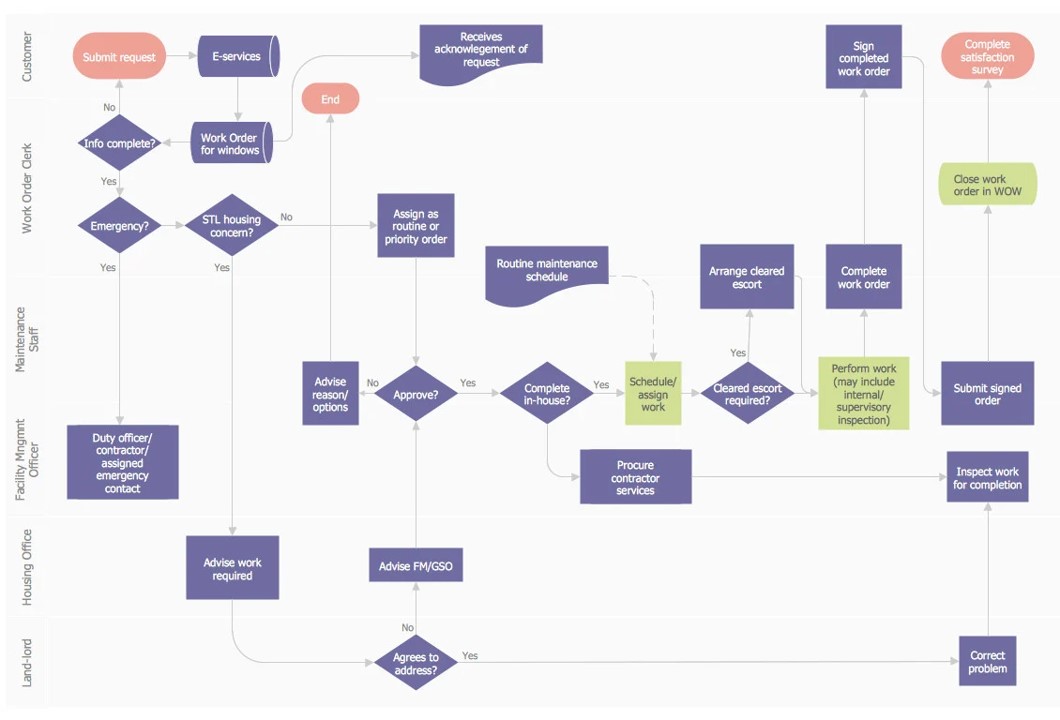
A Six Sigma Master Black Belt consultant was challenged to do process maps for a major client. After weeks of working with the client, he developed a series of flowcharts to represent the major process components of the functional areas scoped within the project. Below is an example of one of the flowcharts using Visio.

Other Useful Tools and Concepts
When it comes to Six Sigma, there is still plenty to learn. As such, you might do well to learn about process entitlement and how the benefits of your processes exceeding expectations impact your bottom line.
Further, you might need to look into how to use a multi-vari chart. There are plenty of ways to visualize variation throughout production, but few gather up three concurrent views for you to pinpoint issues as they arise.